Richer Metadata
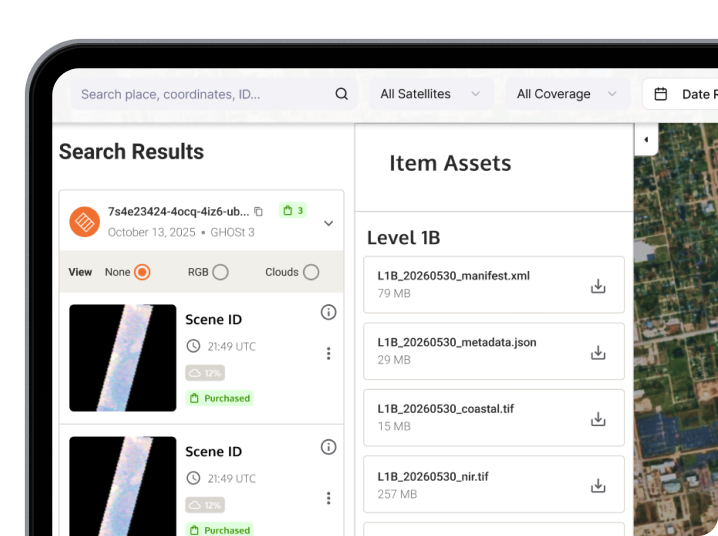
STAC unlocked a far broader set of queryable parameters such as: nadir angle, sensor mode, processing level, cloud cover, and more. It gave users precise control over what data they wanted.

SIGMA Data is the primary interface for Orbital Sidekick’s hyperspectral satellite constellation. Designed to service intelligence community analysts, commercial customers, and OSK’s own internal teams. One product. Three radically different mental models. The design challenge was making each audience feel like the platform was built specifically for them, while building a system and workflow that worked for the data pipeline.
In-depth case study available on request.
Overview
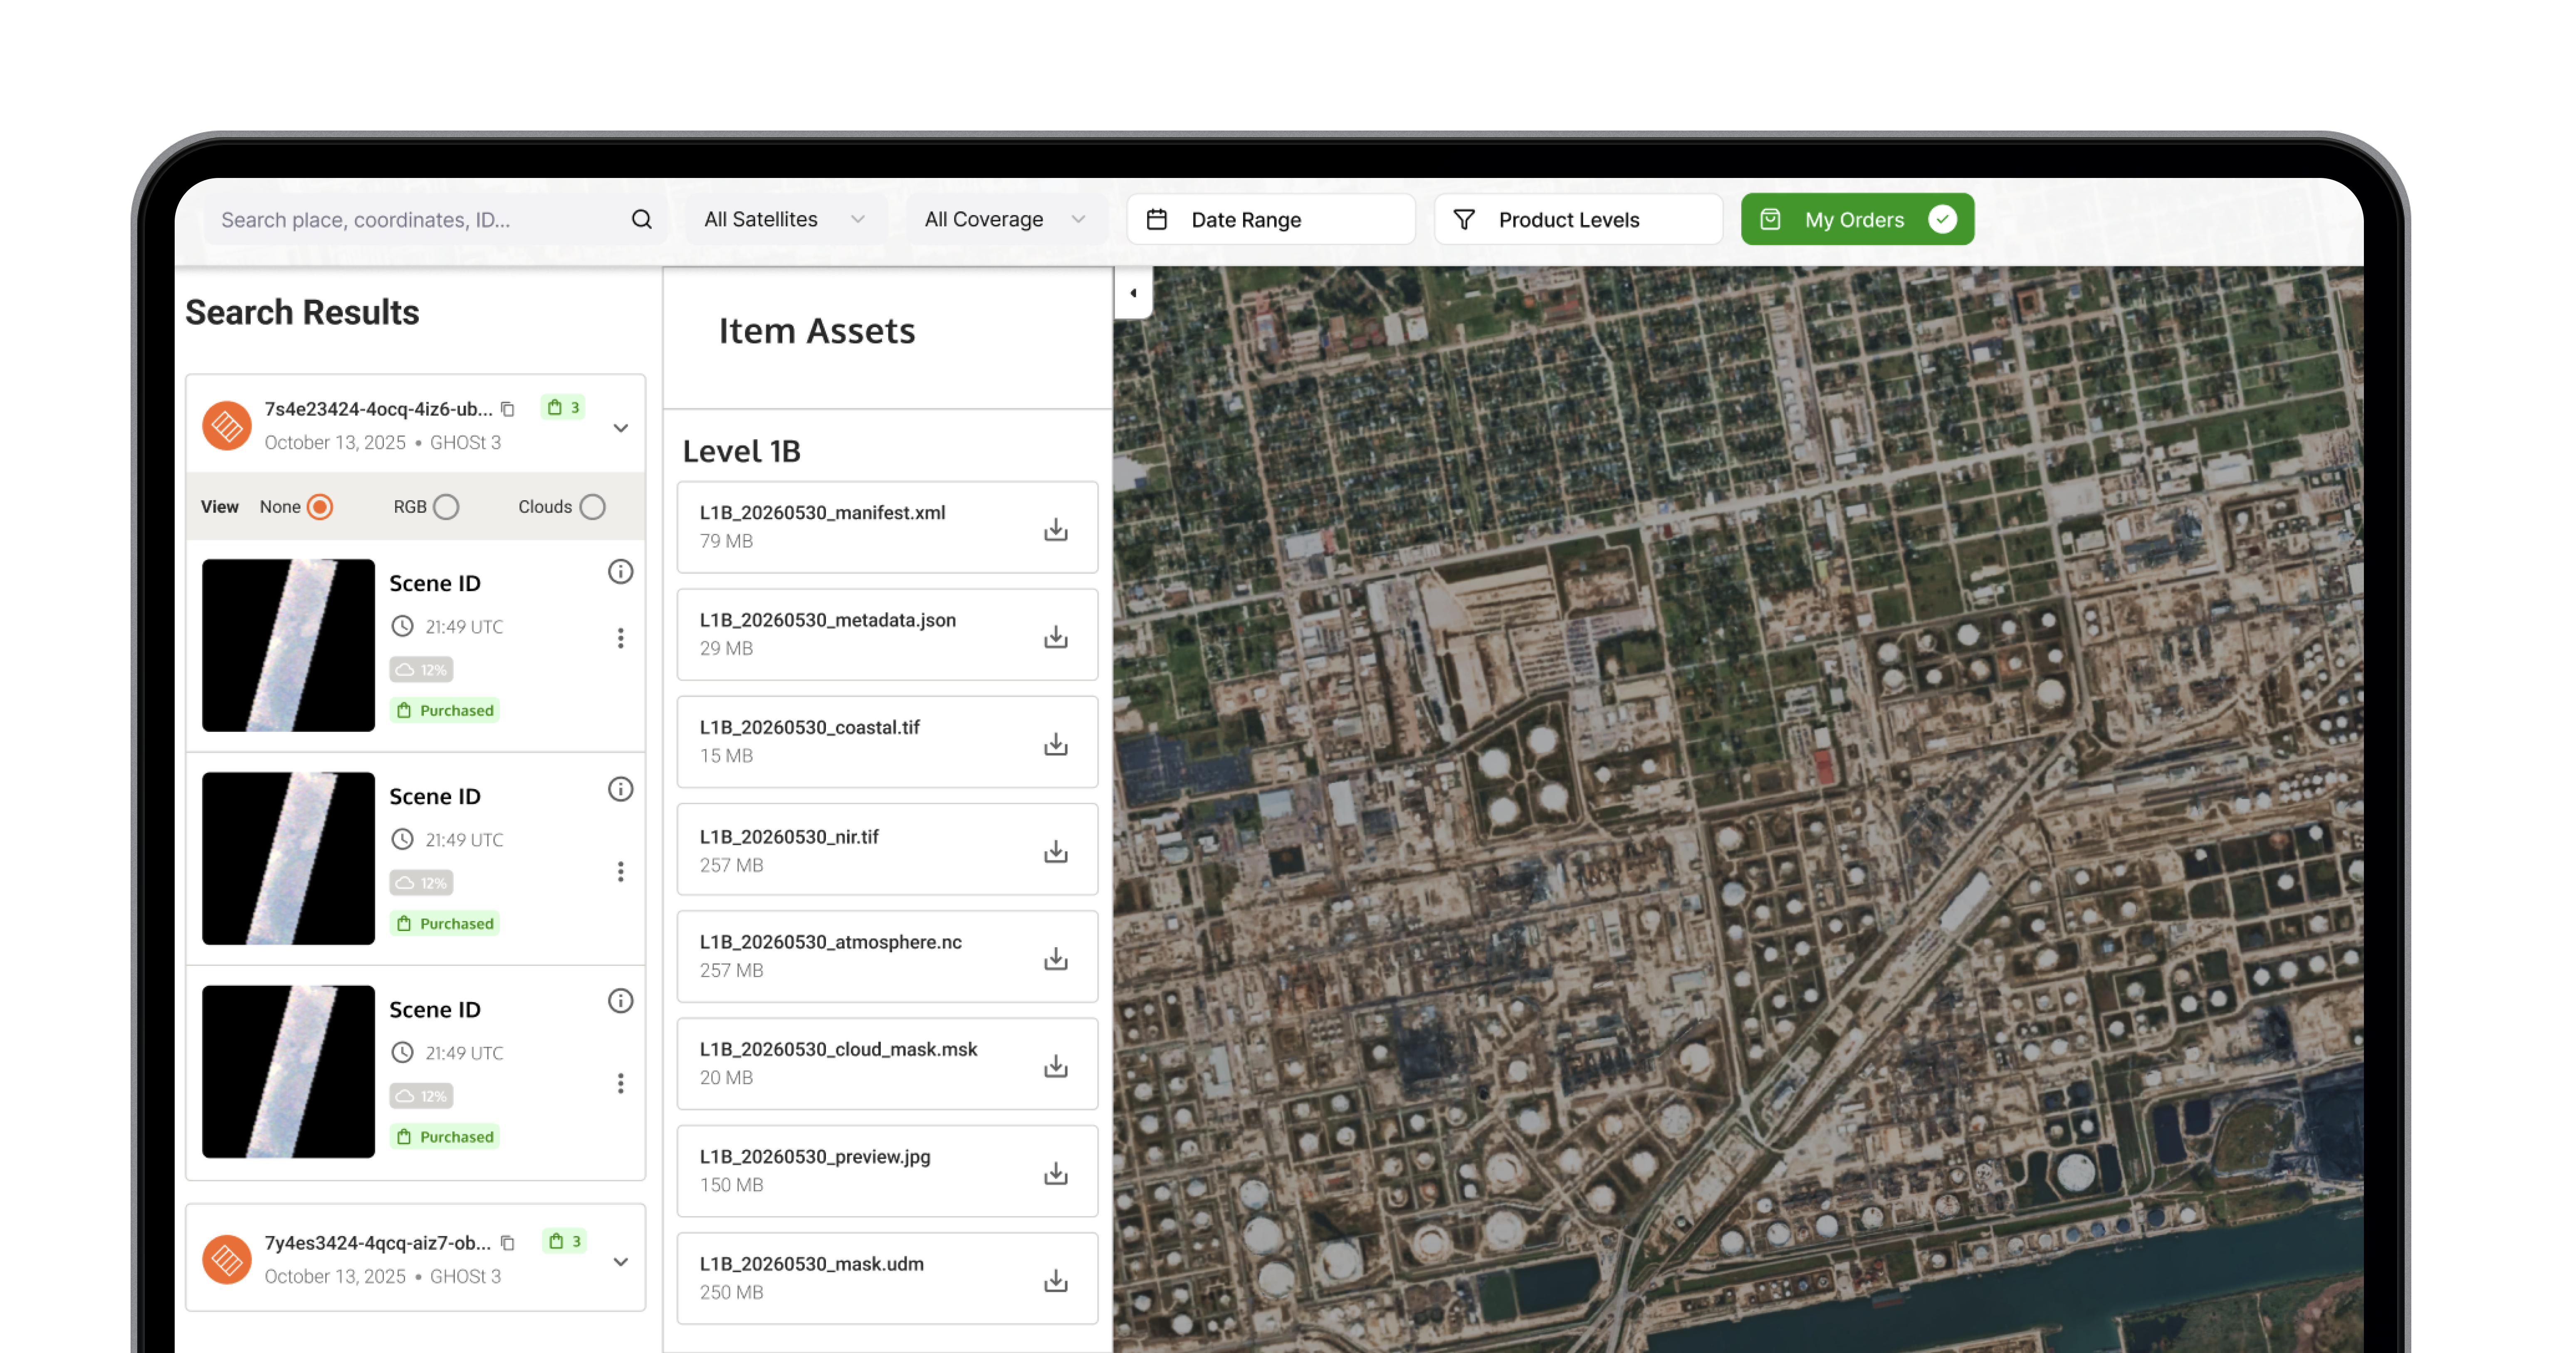
SIGMA Data serves as the primary interface for customers to interact with Orbital Sidekick’s constellation of hyperspectral satellites. The platform enables users to search & filter historical data archives, task satellites for new collections, analyze spectral intelligence from space, and deliver data products to customer S3 buckets.
As OSK’s designer, I was responsible for creating & managing an intuitive experience that makes complex satellite operations accessible to analysts, researchers, and decision-makers. Our goal was to empower the delivery of geospatial data to energy, agriculture, and defense markets, and allow additional industry-trending geospatial endeavors to succeed.
1.6Mkm²
Area of Operations
Monitored & Archived

SIGMA DATA
During discovery, we found that there were three audiences with three different mental models and reasons to access our data products. Tap a card to see which capabilities each one depends on most.
An independent American not-for-profit VC firm based in Tysons, Virginia. It invested in OSK to keep the Central Intelligence Agency, and other intelligence agencies, equipped with the latest in hyperspectral data & insights, in support of United States intelligence capabilities.
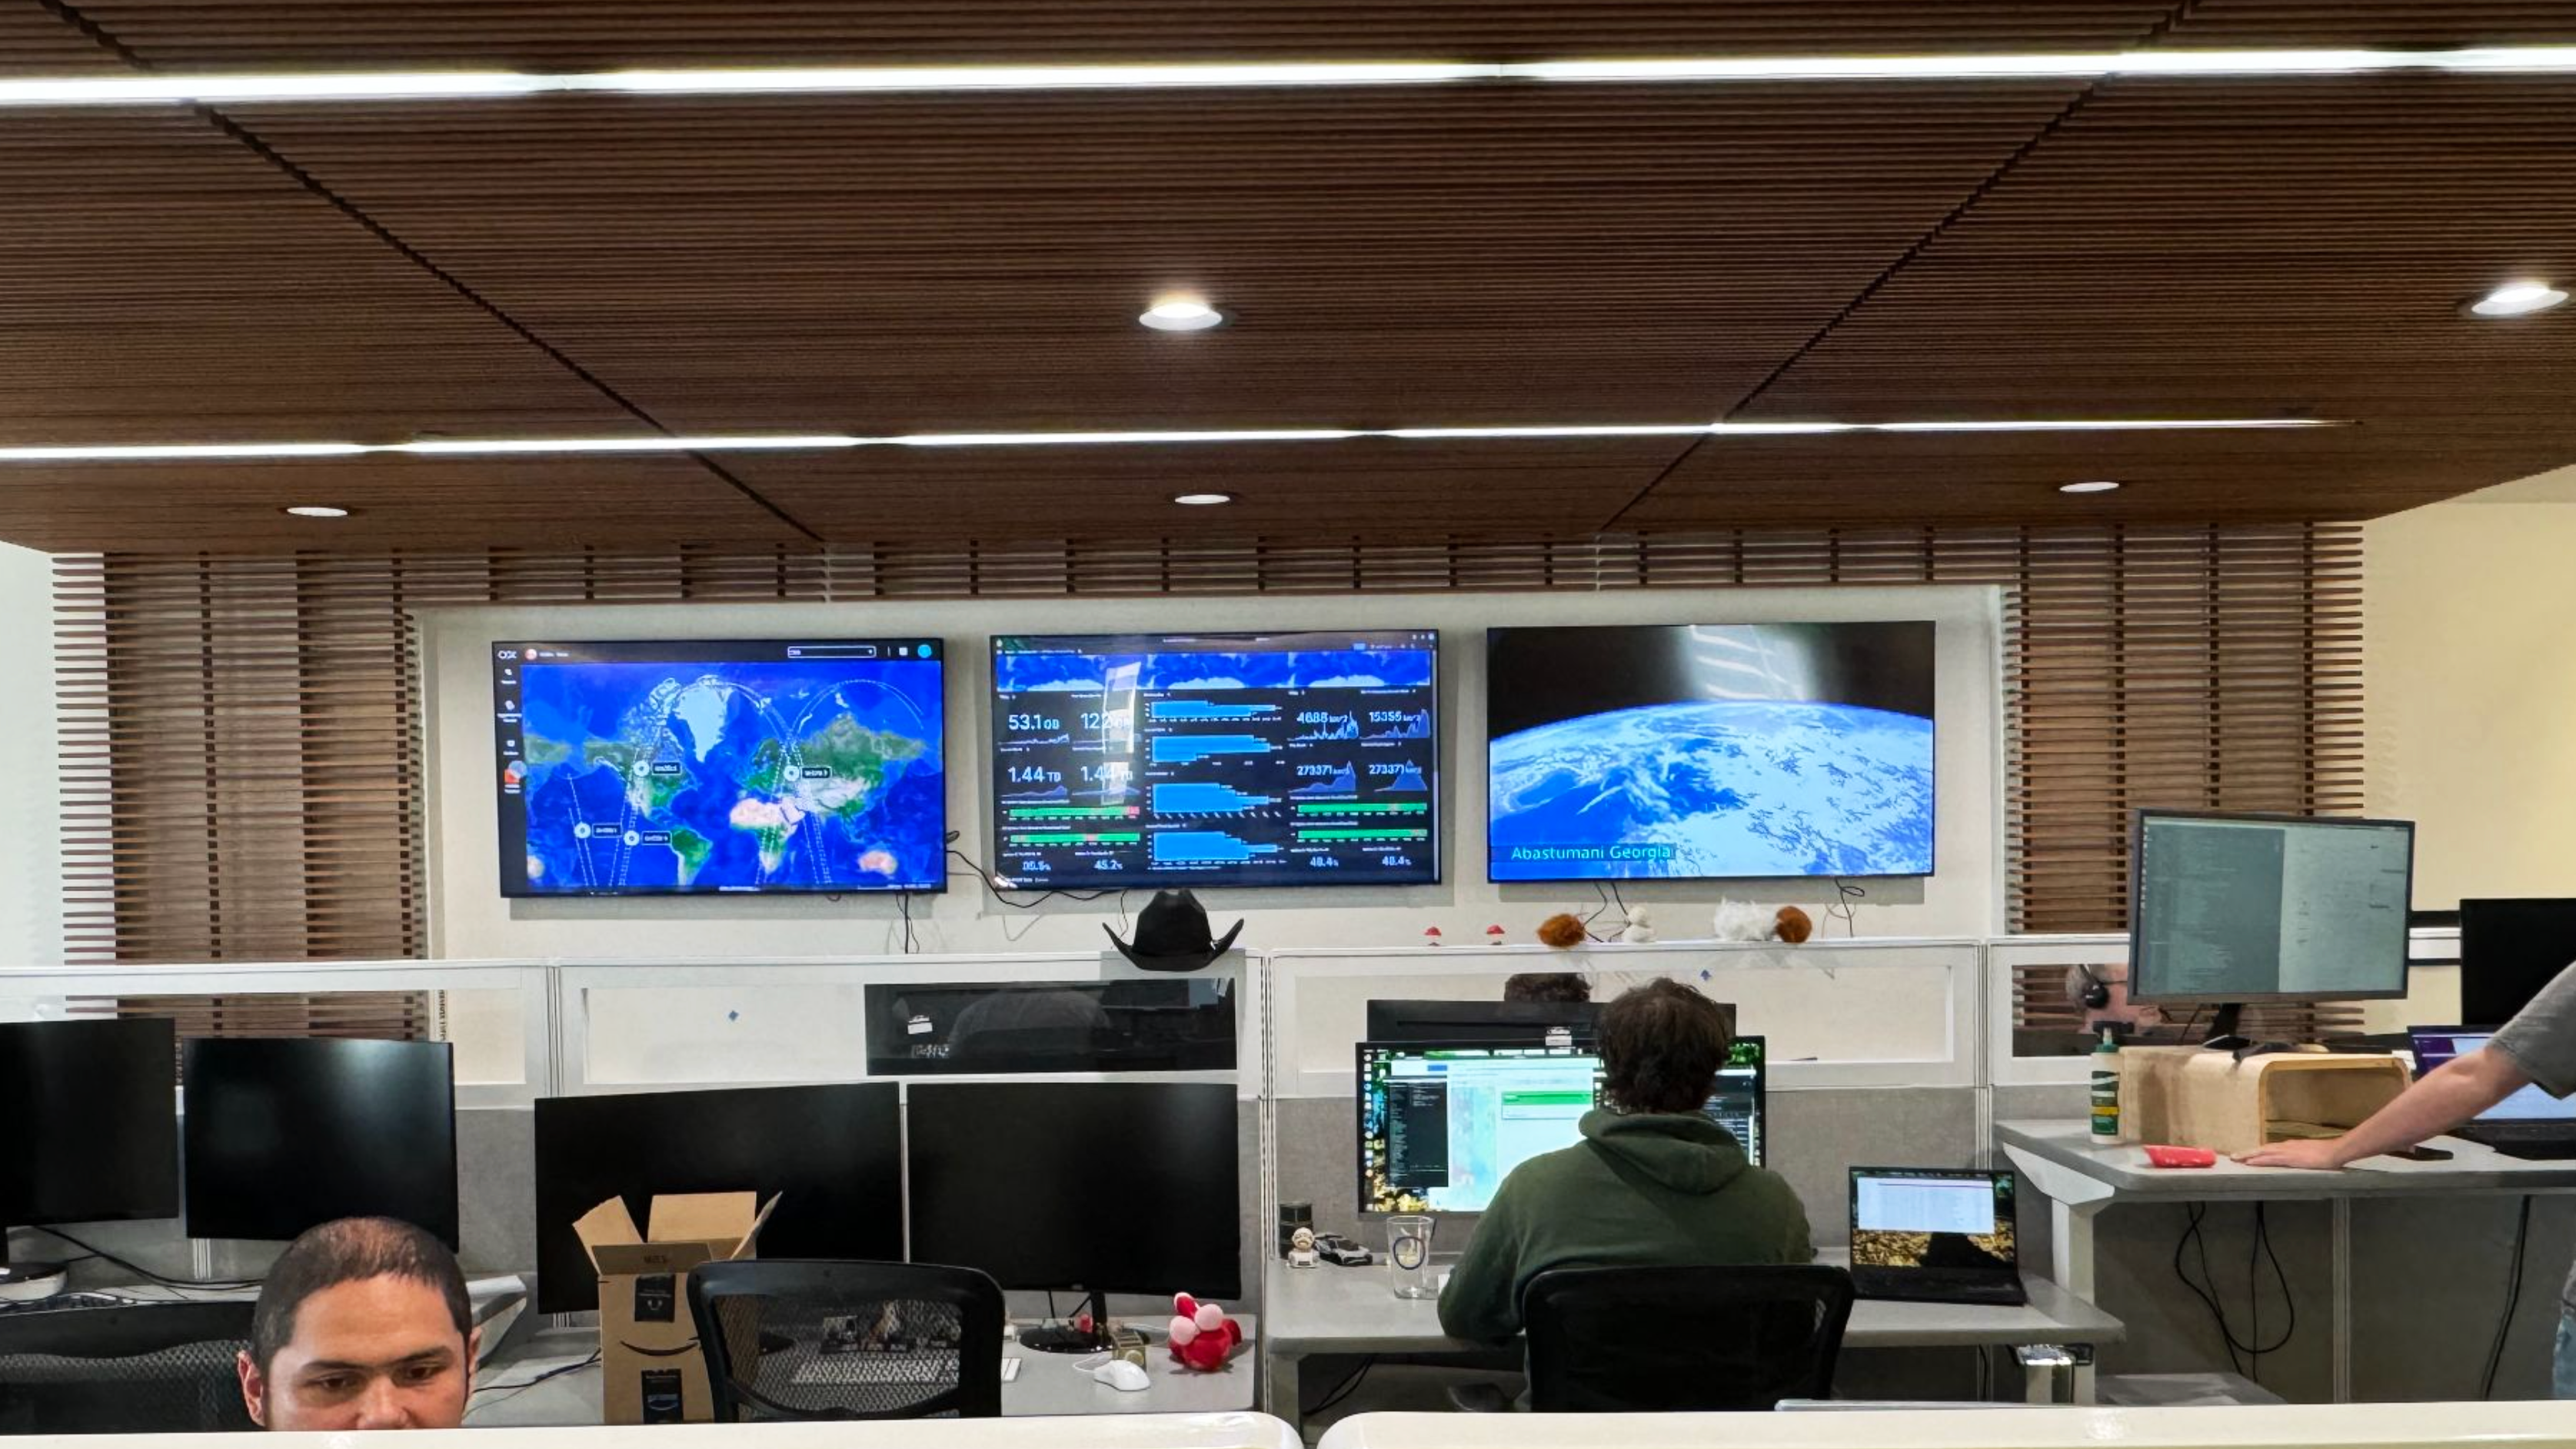
Operating Environment
SIGMA Data wasn't designed in isolation. We studied how OSK's team actually works, with analysts at their desks and active collections and deliveries up on the room's large displays. That observation fed real human factors back into the interface and kept the product grounded in how the job actually gets done.

A machine learning model turns a photon into an insight. But before users could search, task, and order those insights via a user interface, you had to build the data pipeline to fulfill each customer’s unique product experience.
The Science
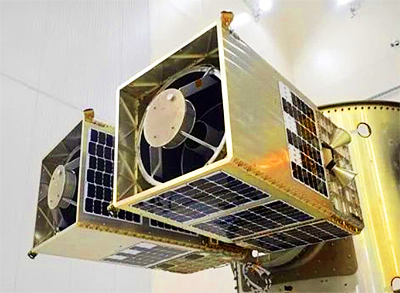
A normal camera records three broad colors. They are red, green, and blue. GHOSt records 472 narrow, contiguous bands from visible light through shortwave infrared. Because every material reflects light in a unique spectral signature, those bands don’t just show what a place looks like, they reveal what it’s made of.
SIGMA Data had to deliver a chemistry lab, to the user...

Three wide buckets blended into a single visible color. Enough to see a scene, but not enough to identify what’s in it.
Hundreds of narrow bands from the visible to SWIR. Each pixel carries a full spectral curve, a fingerprint of the materials it contains.
Signal to Decision
The same photon serves a scientist, an analyst, and a decision-maker very differently. Processing levels are a ladder: each rung trades raw fidelity for usability, climbing from calibrated radiance to ready-to-act intelligence that was ingested into the SIGMA Data Platform for ordering, browsing, and download.

472-band
spectral cube
processed into →
Calibrated spectral data
raw radiance · full 472 bands · ENVI / GeoTIFF
Run their own spectral models, train detection algorithms, and validate against ground truth.
Georectified imagery Most customers start here
map-aligned · drop-in for GIS · cloud-masked
Overlay directly in their GIS, measure change over time, and brief findings without preprocessing. The workhorse format most orders are delivered in.
Indices, detections & alerts
methane plumes · vegetation stress · burn ratio · change
Act on a finished answer: a flagged methane leak, a fire-risk map, a structural-damage assessment.
Data Architecture
Behind that ladder sits the technical architecture. Each processing level is a deliberate trade: how much OSK does to the data before delivery, versus how much the customer does themselves. Here's what each level actually contains.
Data Standards & Infrastructure
In a workshop with Element 84, engineers and designers side by side. We mapped out OSK's full data pipeline, constellation architecture, and hyperspectral data types.
The outcome was converting OSK's entire data catalog to the SpatioTemporal Asset Catalog (STAC) and SpatioTemporal Asset Tasking Interface (STAPI) standards. This was a foundational infrastructure decision that cascaded into almost every customer-facing capability in SIGMA Data.
It unlocked even more richer & powerful abilities for SIGMA Data's data products, capabilities, and user interface elements.
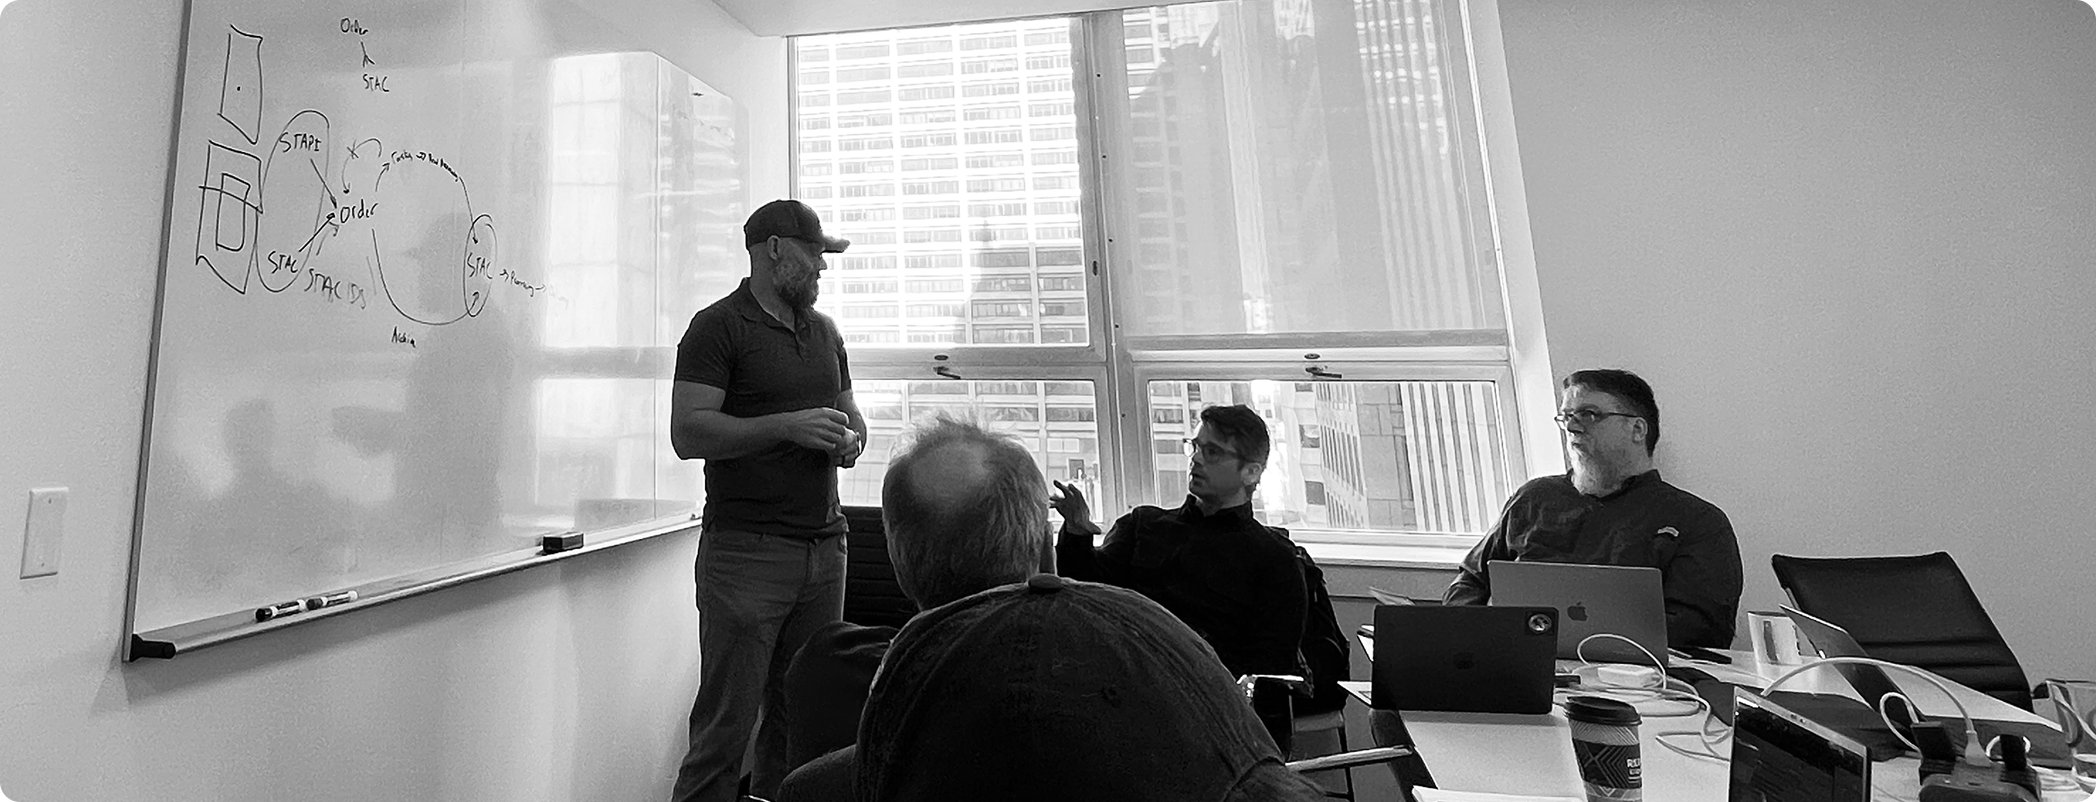
STAC/STAPI Workshop between Element 84 and OSK's software engineering team. Together, we made OSK's data STAC/STAPI configurable for commercial use.
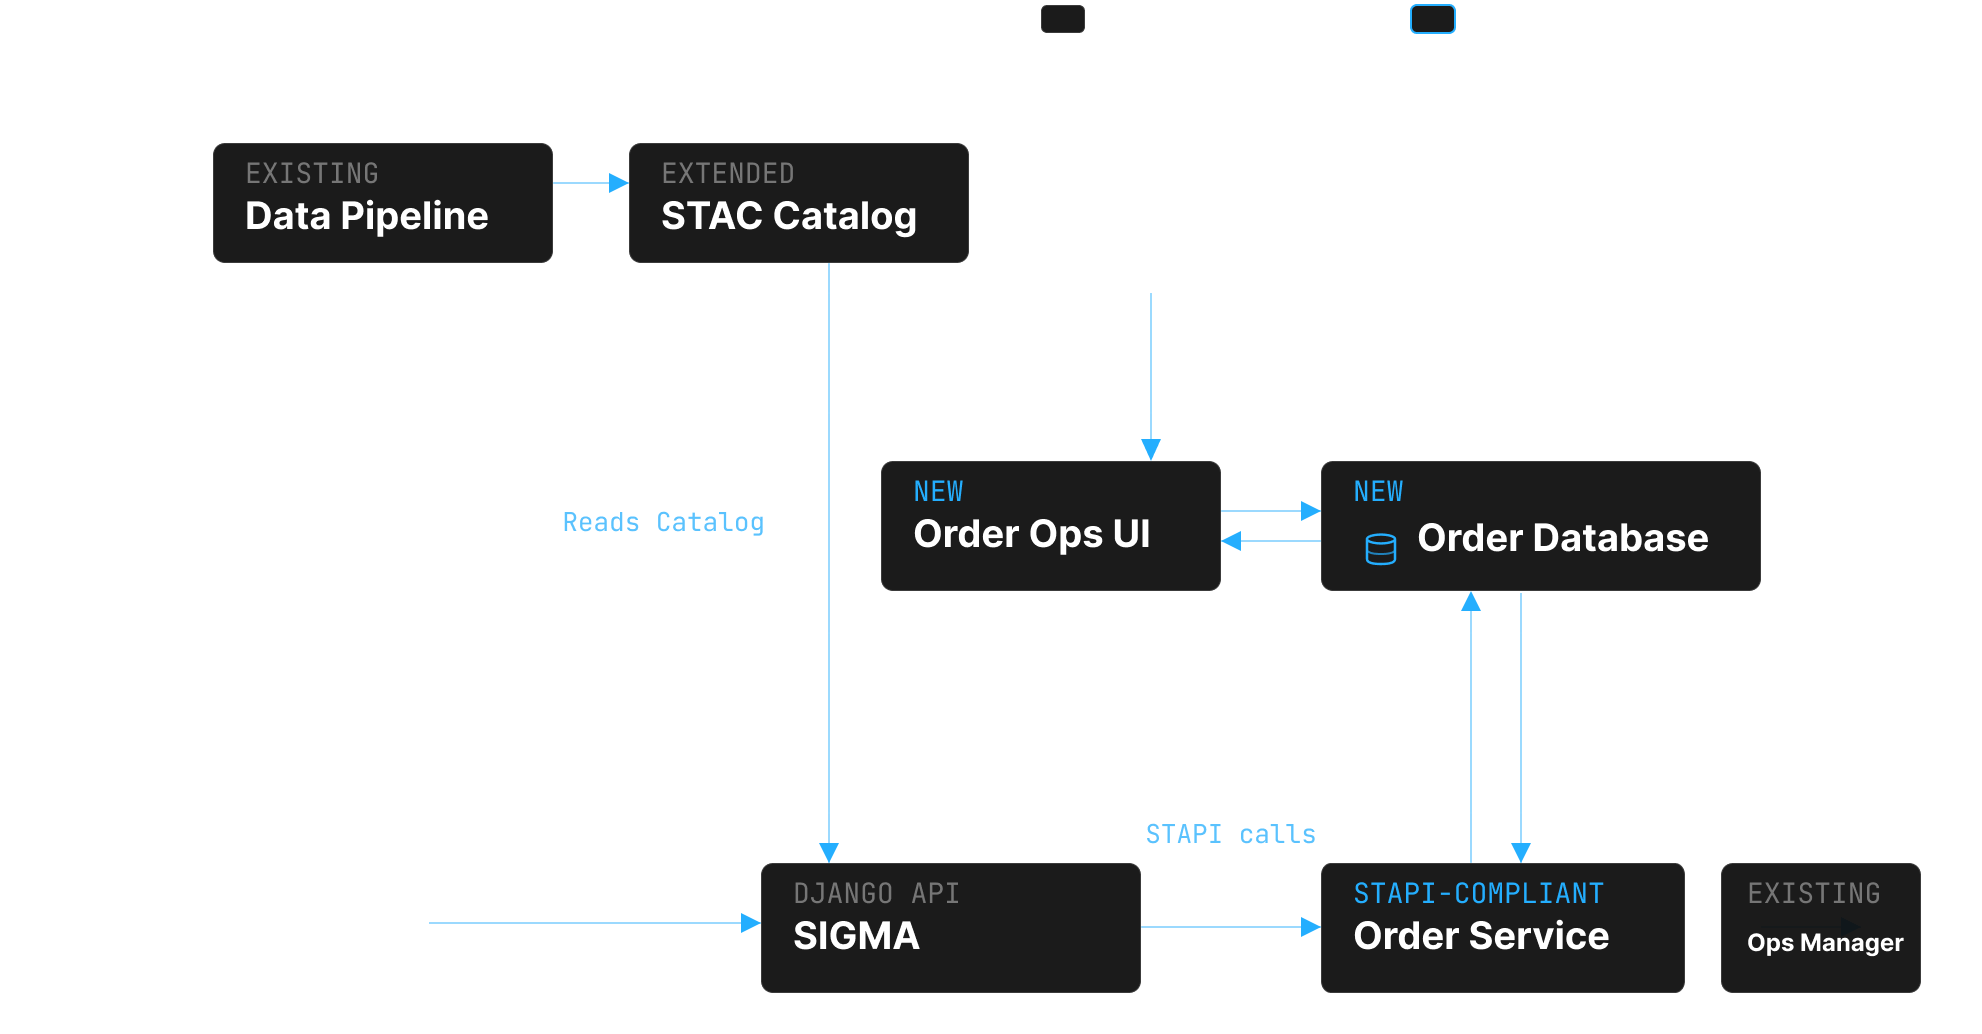
STAPI defined the order contract between SIGMA, the new Order Service, and the GHOSt constellation's Operations Manager. Order Operations UI gives Customer Success a way to manage order status, while STAC provides the catalog backbone.
What STAC / STAPI Unlocked
STAC unlocked a far broader set of queryable parameters such as: nadir angle, sensor mode, processing level, cloud cover, and more. It gave users precise control over what data they wanted.
STAPI-compliant metadata directly powered the customizable filter ribbon in SIGMA's map interface, allowing analysts to pin their most-used parameters and configure the ribbon to match their workflows.
STAC compliance meant customers could plug OSK's API directly into their own tools, pipelines, and platforms without custom integration work, unlocking commercial and government partners at scale.
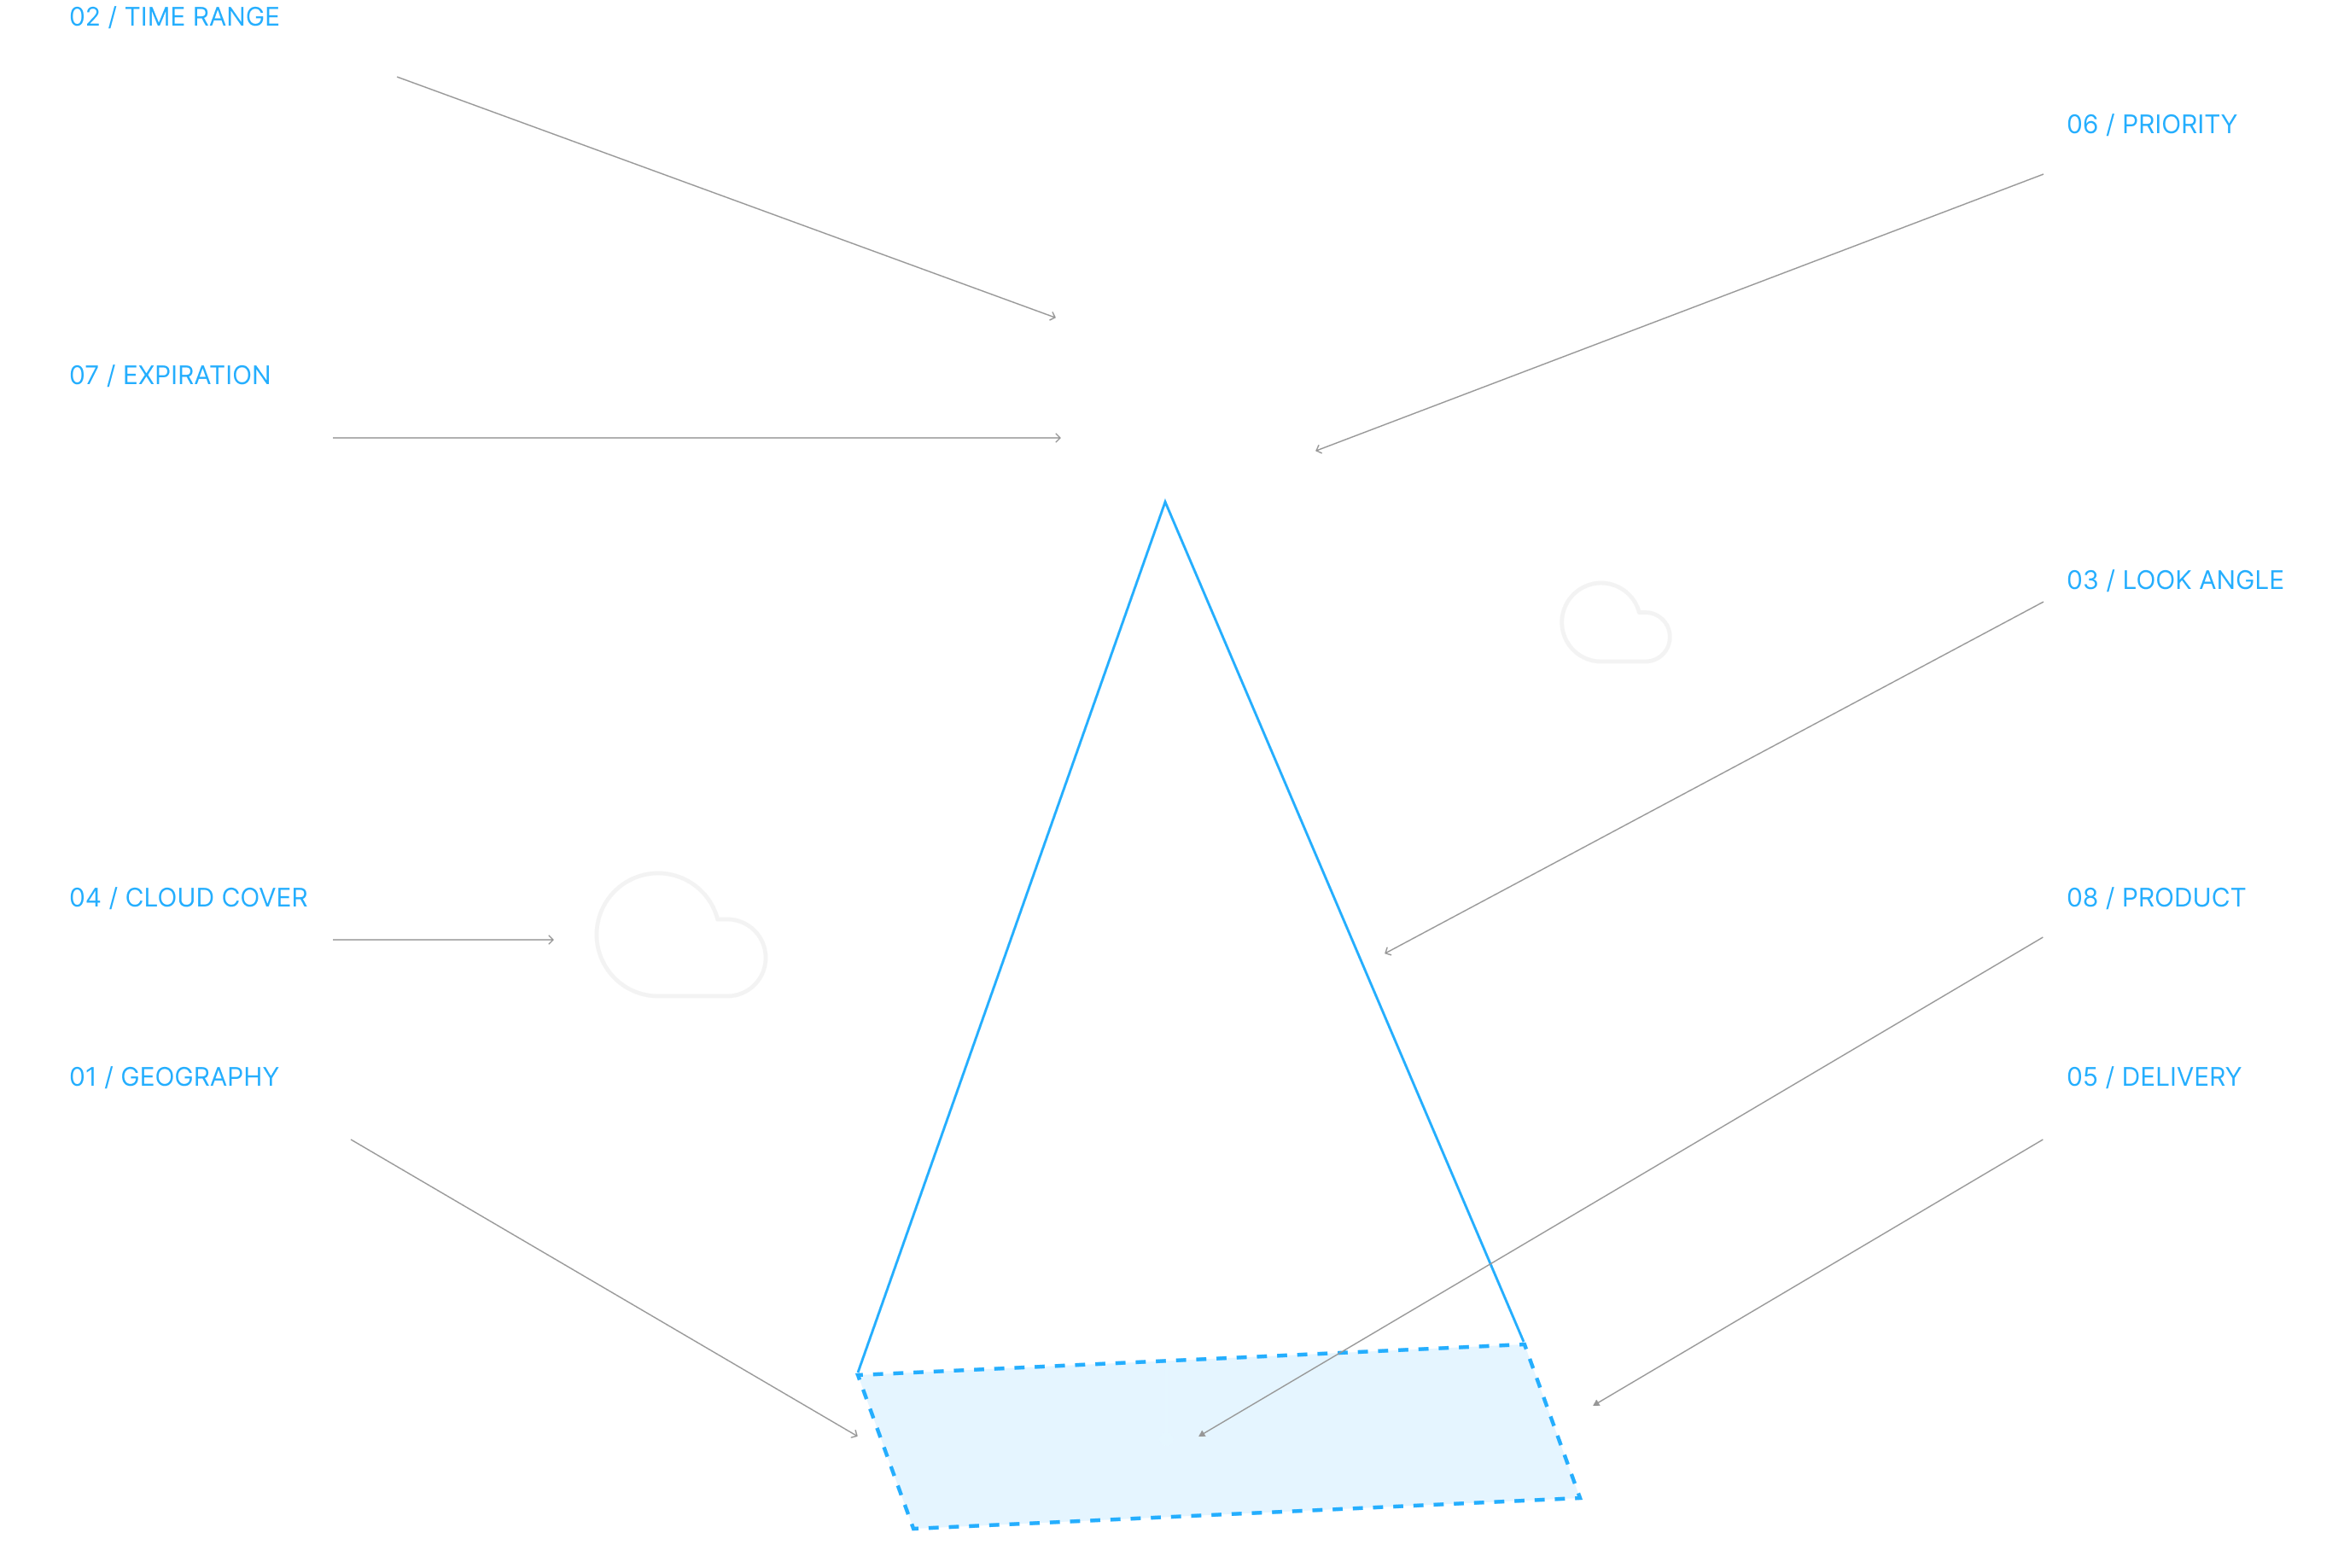
STAPI defined the order contract between users, OSK's services, and the GHOSt constellation. This enabled product configurations like geography type, time range, nadir angle, cloud cover threshold, delivery location, and processing priority.
STAPI Product Configurations
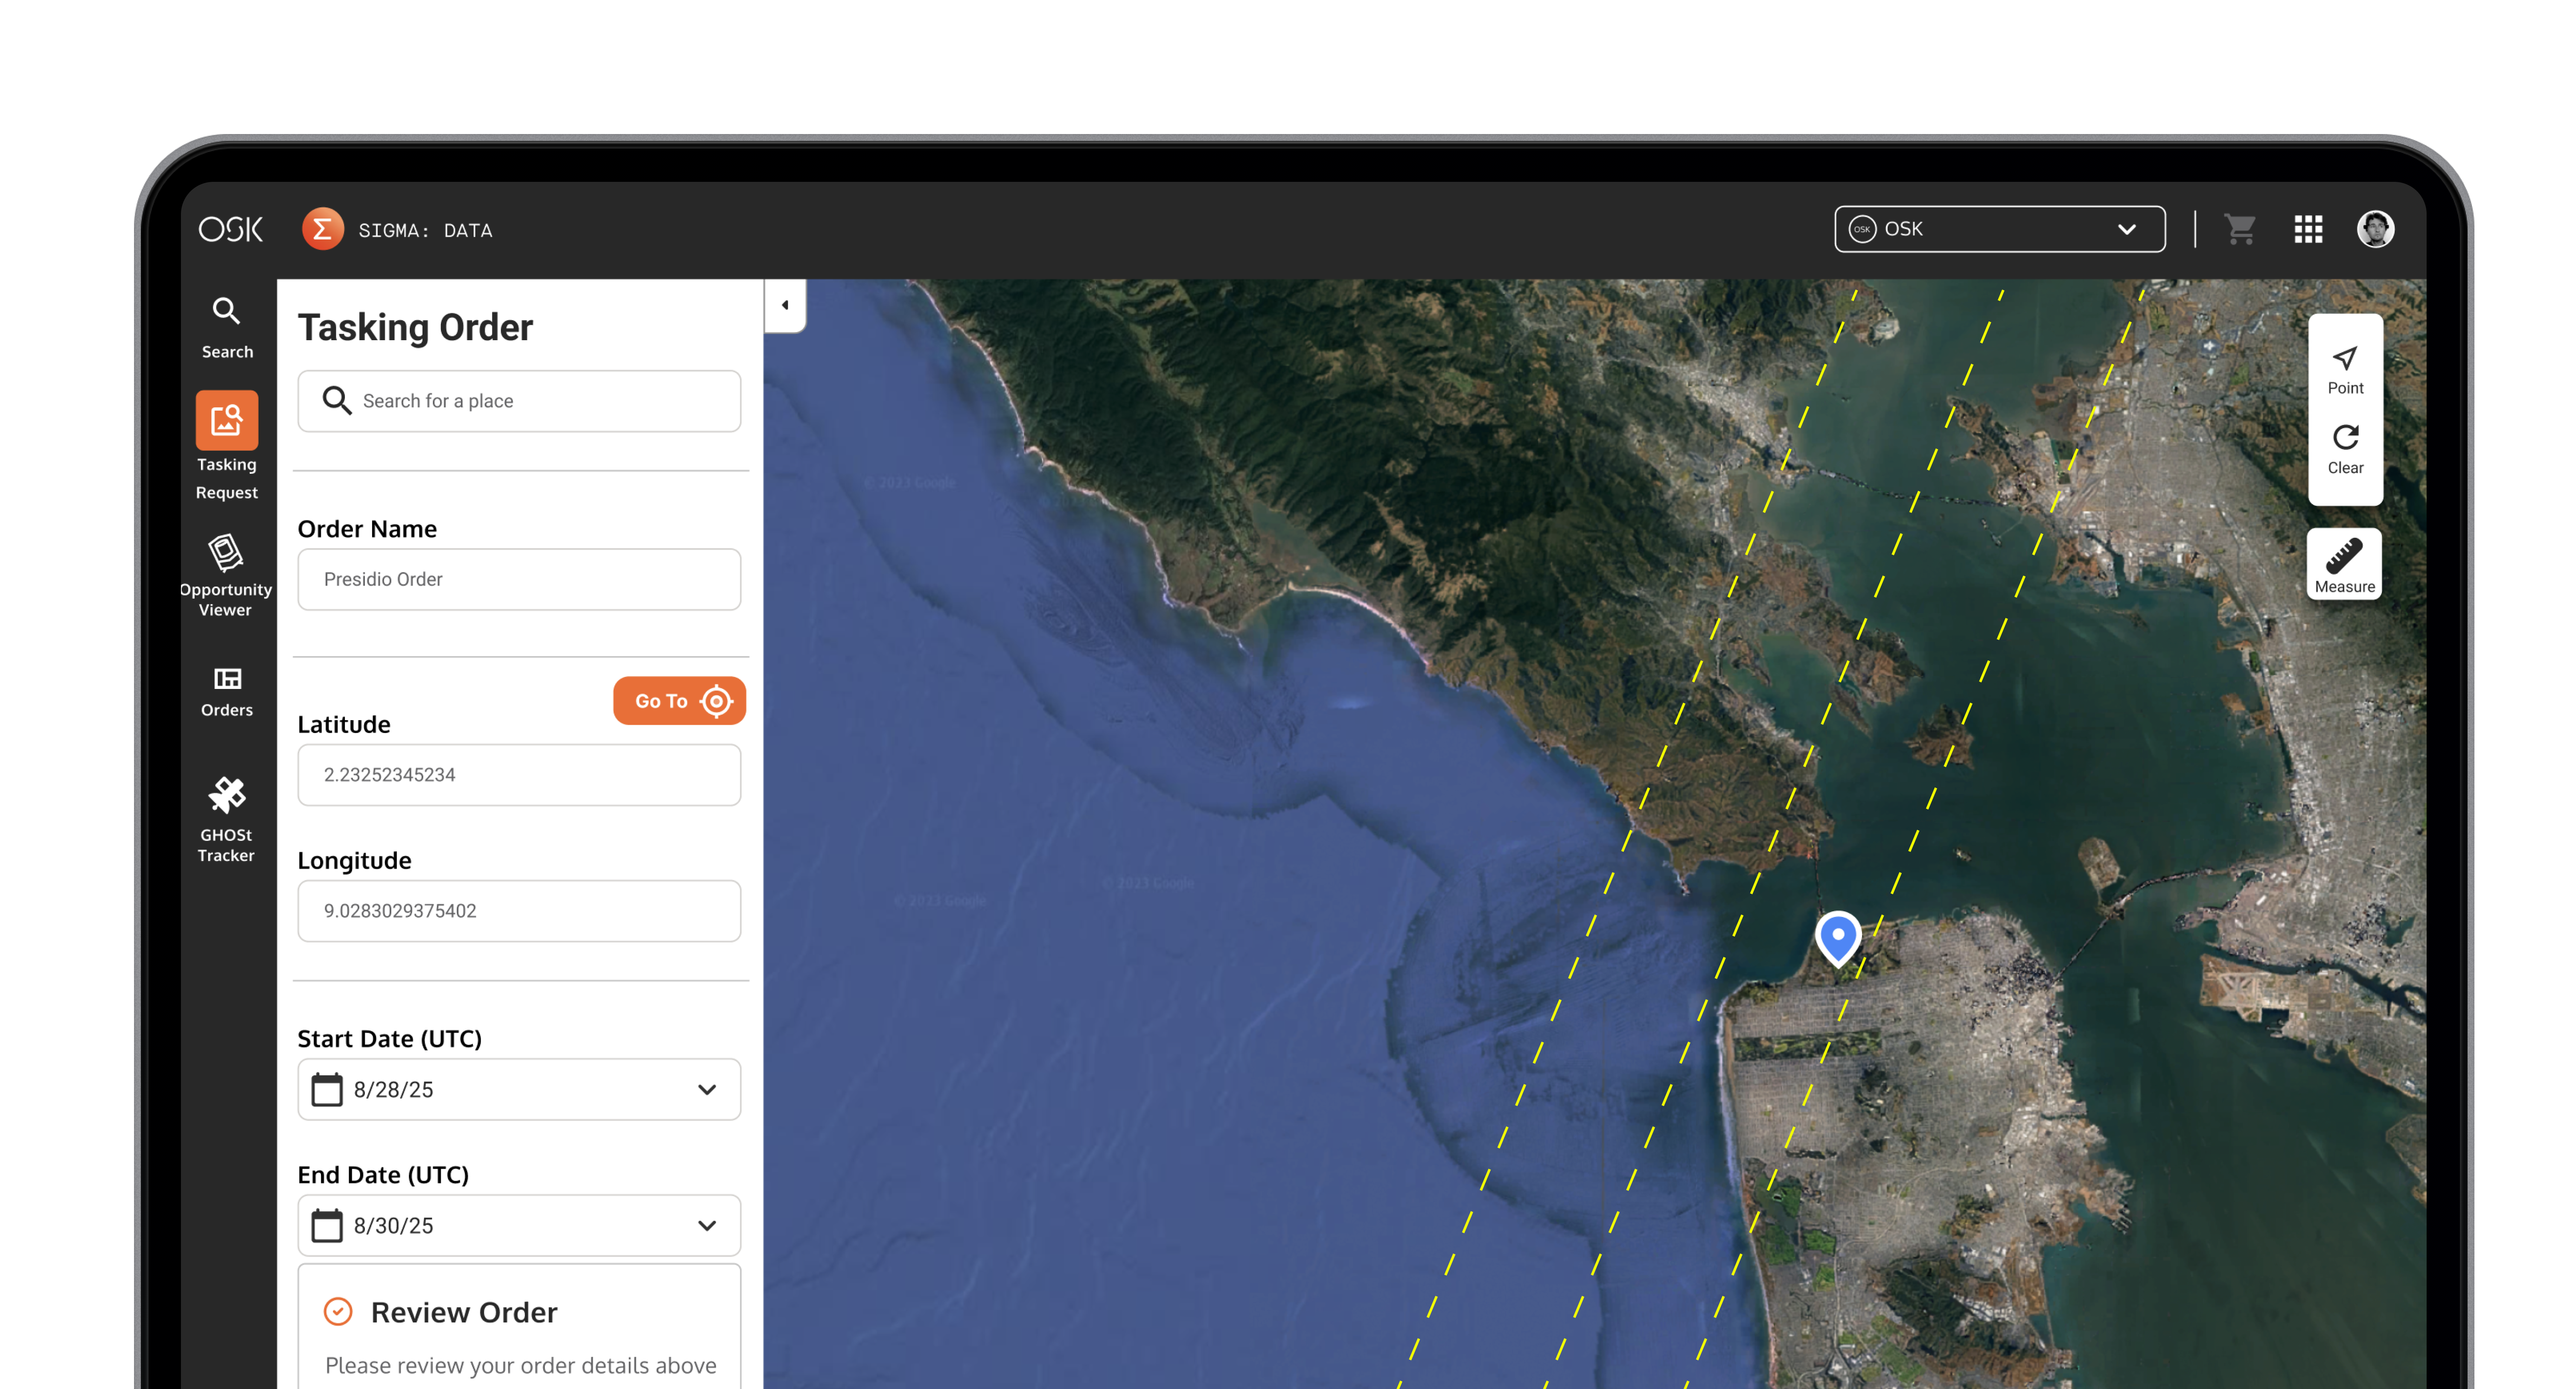
When submitting a tasking order, users configure their selected product with a set of defined parameters. These were translated directly from the STAPI specification into SIGMA's order form UI. Each one was mapped to a real physical or operational dimension of a satellite GHOSt pass.
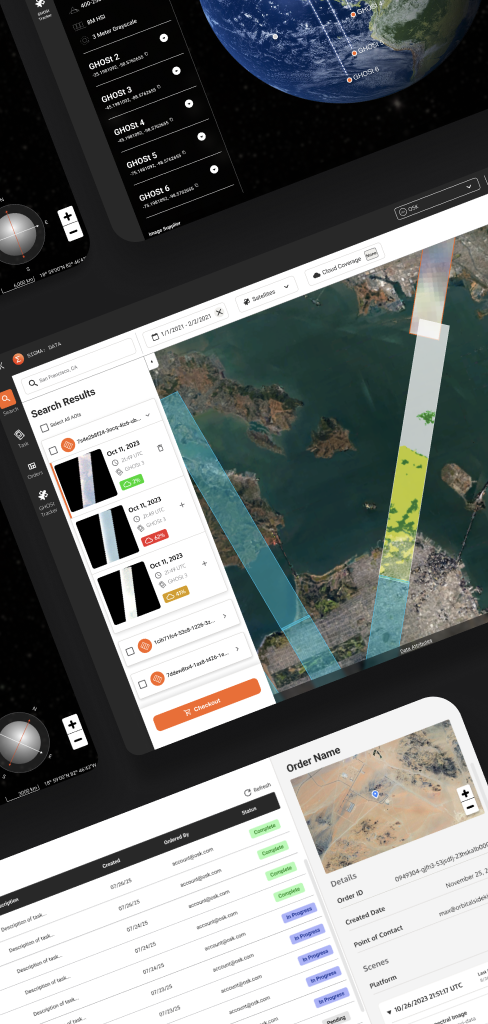
Core Experiences
When combined with the architecture, customers, and use cases, SIGMA Data was built around a set of core capabilities that transform how users interact with the satellite constellation, geospatial data archive, and data products. Together, this solution serviced researchers, operators, and decision-makers alike.
Map Based Search
Early SIGMA users had to enter bounding box coordinates manually, a workflow that excluded non-GIS analysts. The platform needed to meet users where they were: thinking in places, not just numbers.
Discovery
"I have a large Excel file list of locations. Supporting the ability to copy and paste the field into the search bar saves me so much time."
Director of Government Programs
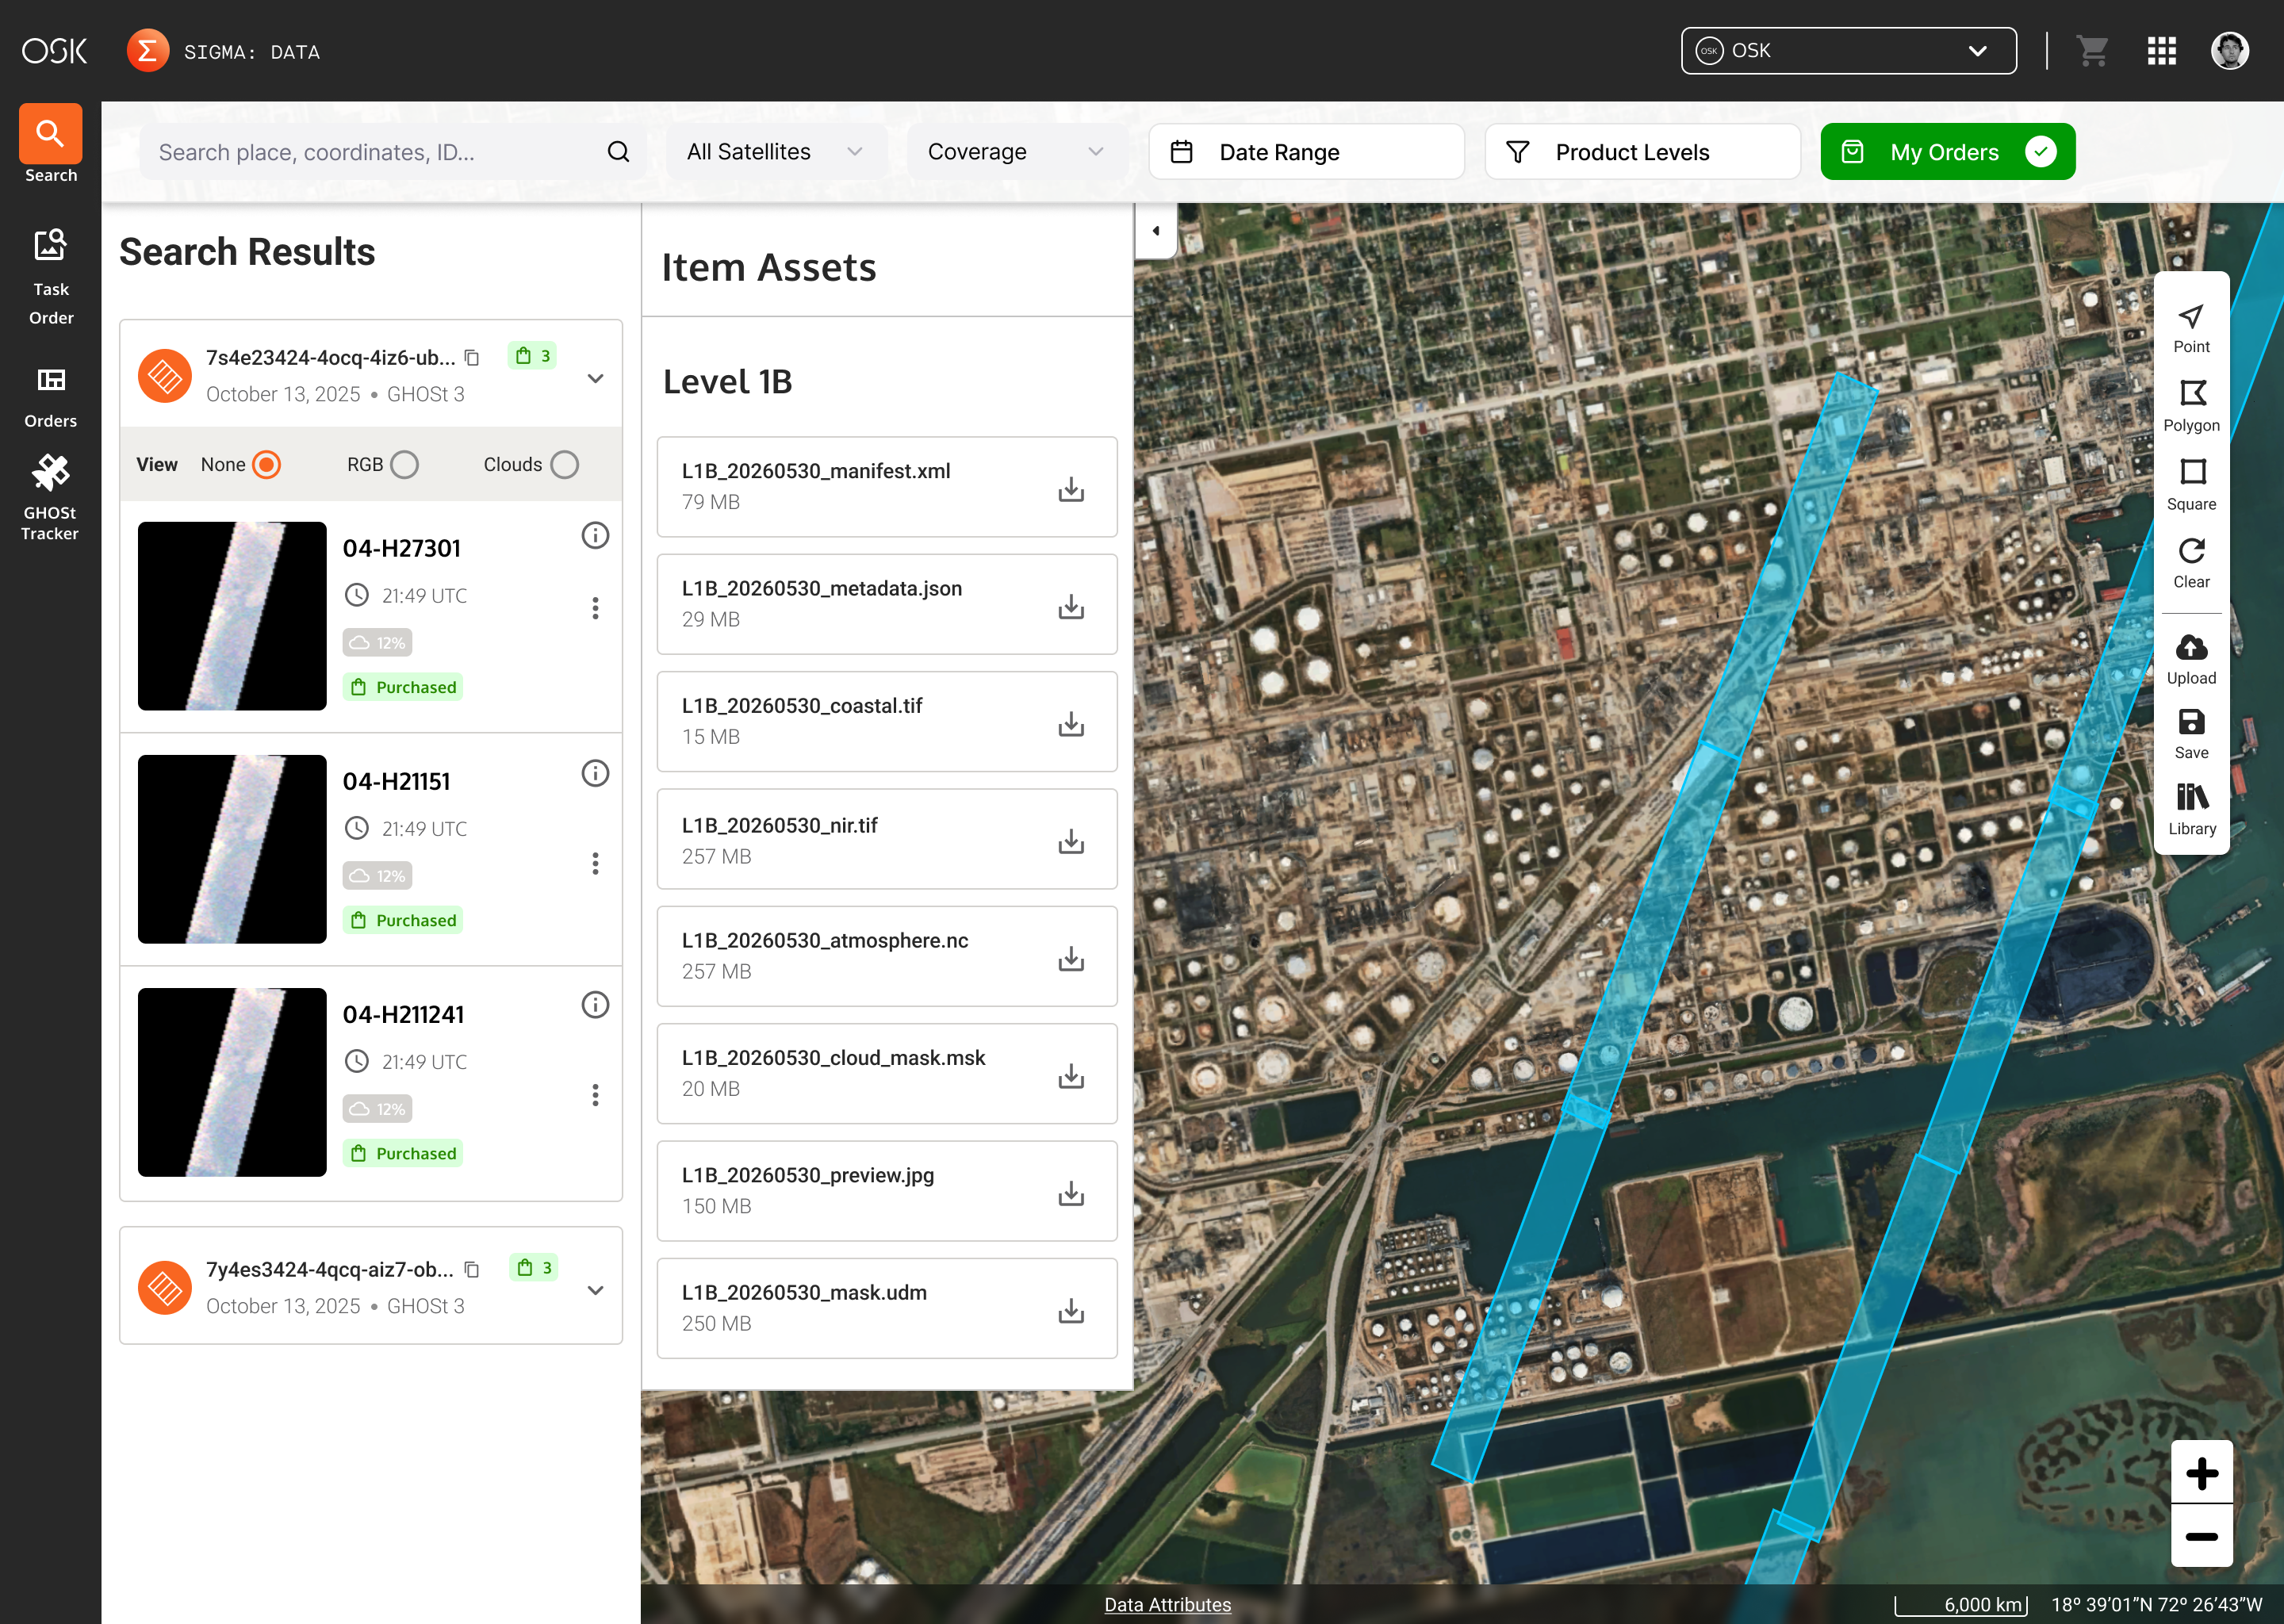
Draw, pin, paste coordinates, search an existing Task ID, Place, or upload a shapefile. Map based searching accommodated for multiple use cases, ensuring that you could get the data products you needed and the job done.
Discovery
"I only ever use the same three filters. Having everything visible at once just makes it harder to find what I need."
Image Specialist
Advanced Filtering
SIGMA served everyone from payload engineers needing precise technical control to sales teams with far less GIS expertise. A single static filter panel either overwhelmed or under-served. The design challenge: build one filtering system that worked for everyone, with persistent preferences across sessions.
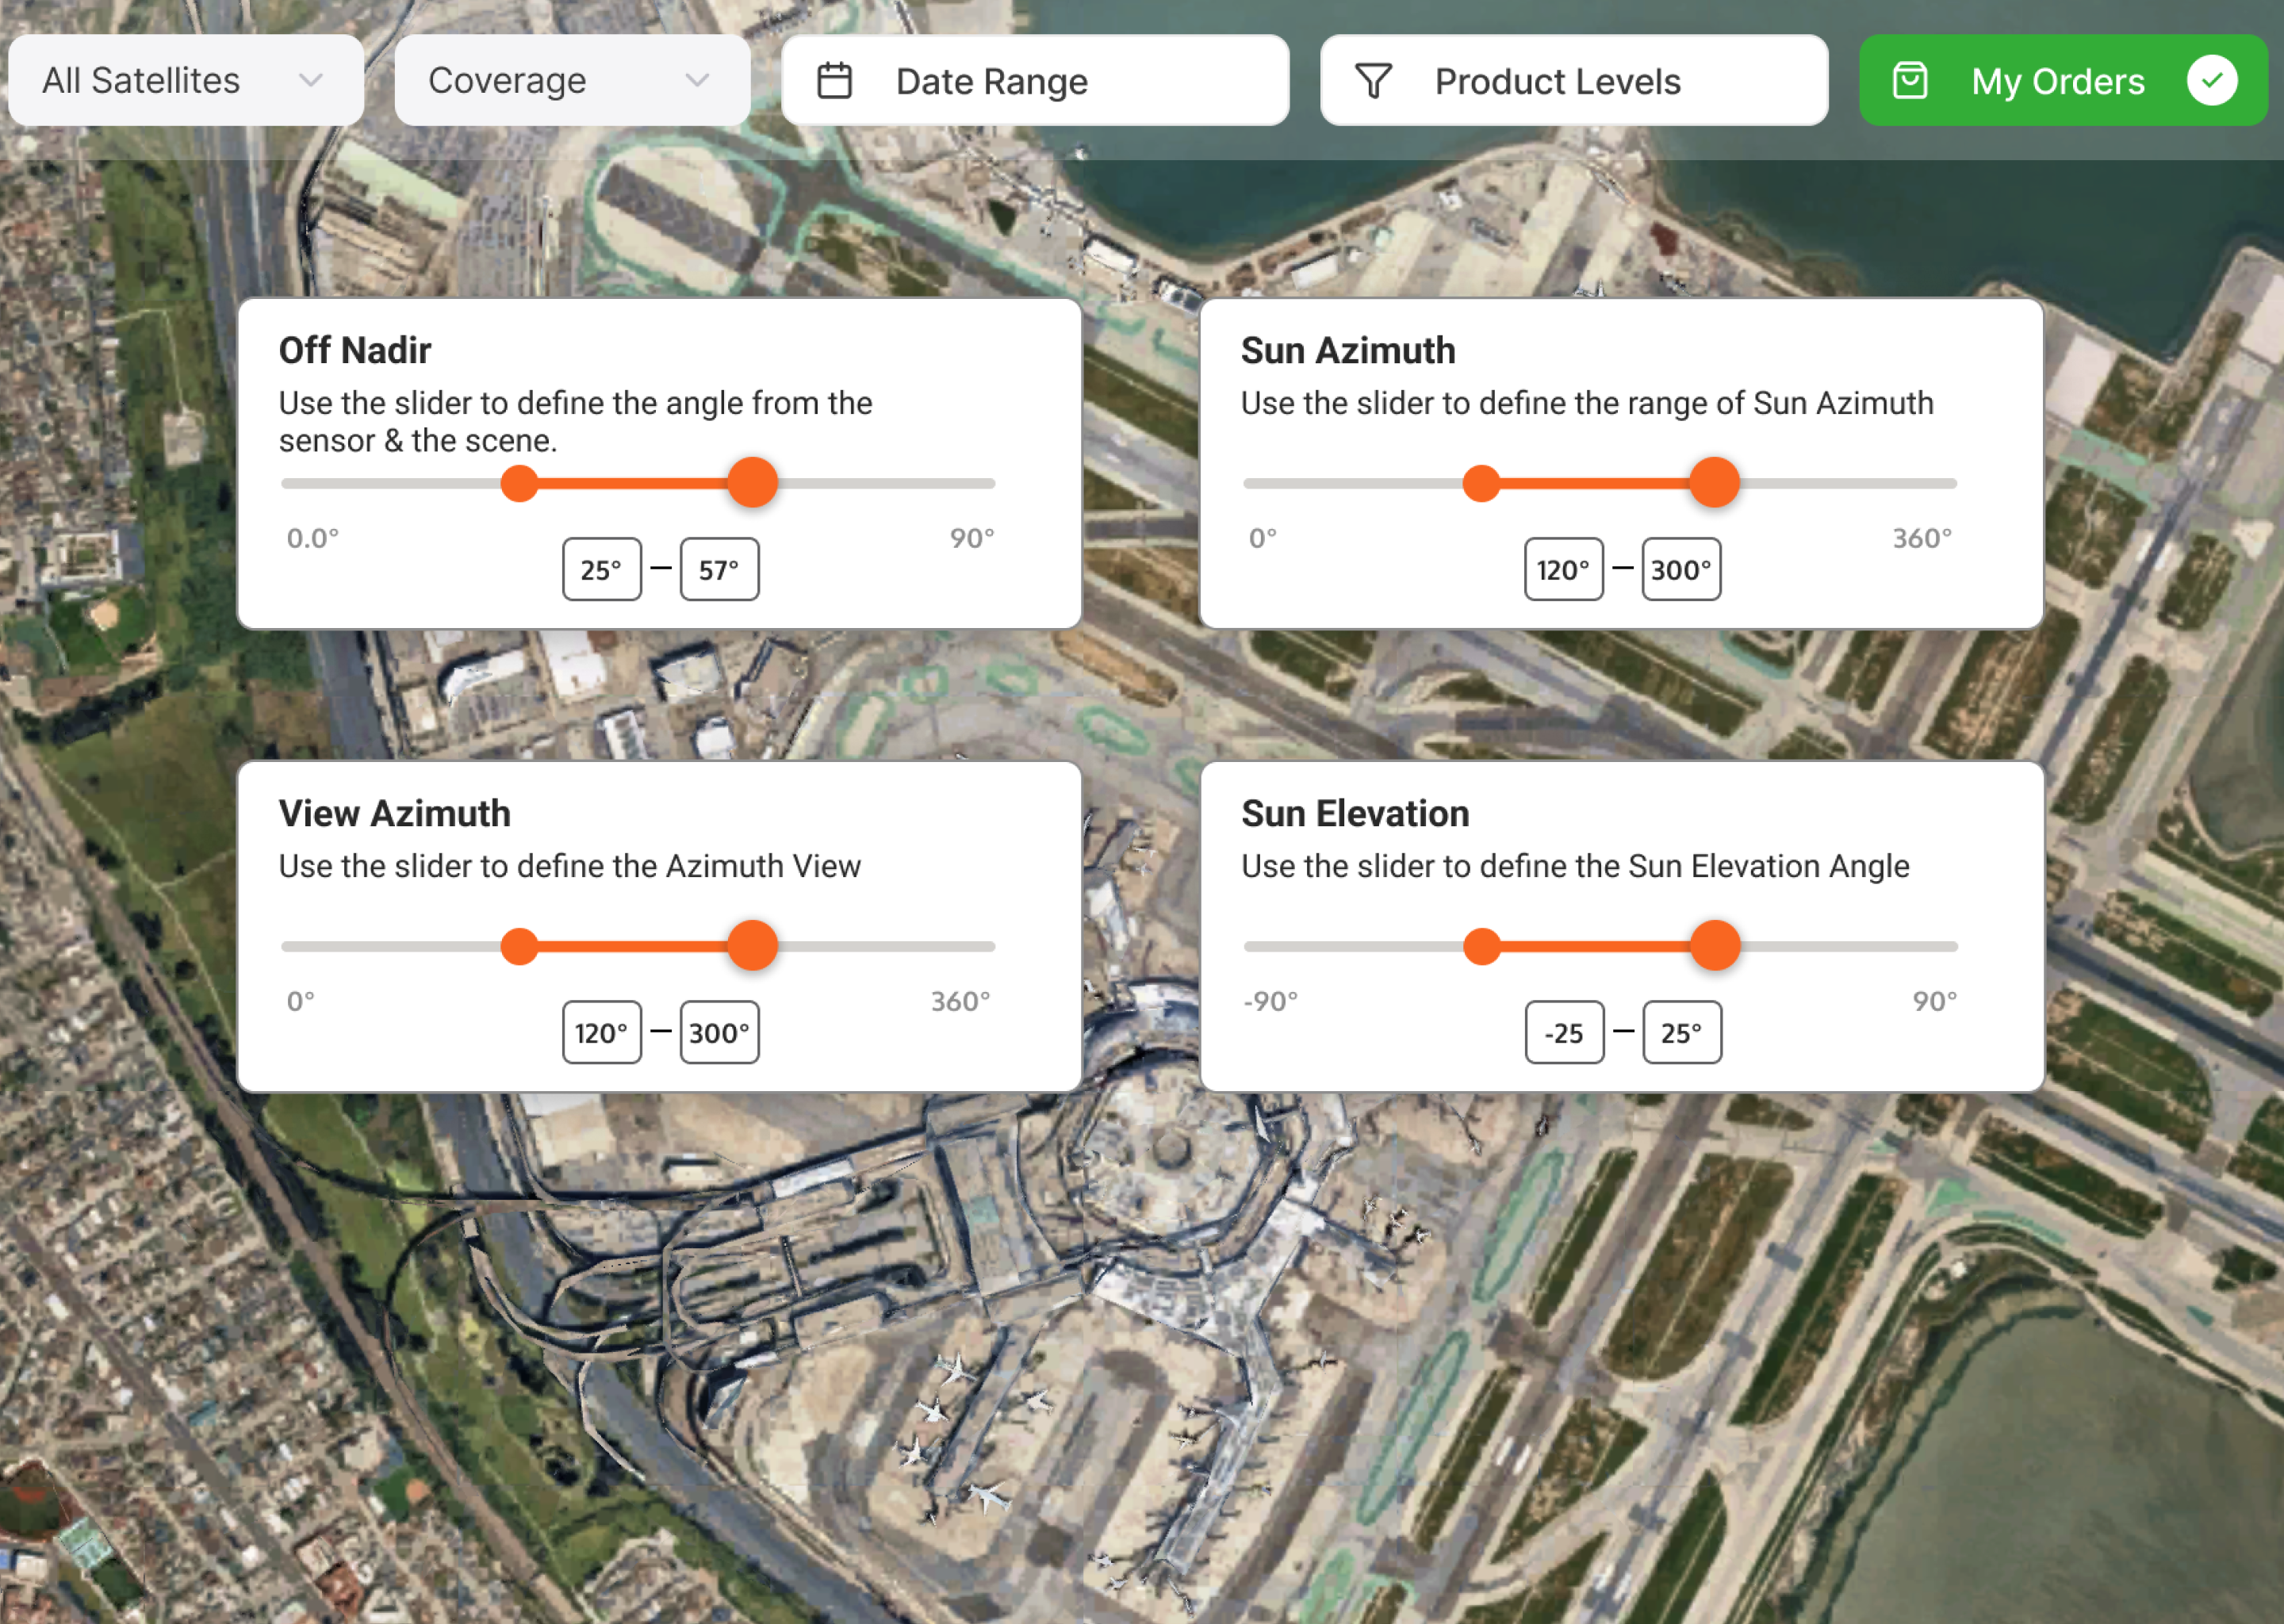
Satellite, time range, and cloud cover stay visible by default, clean and accessible with zero configuration needed. STAC then extended the filter set with geometry parameters like nadir, azimuth, and sun elevation, making it far more robust to refine a search and get people to exactly the data they needed.
Satellite Tasking
Requesting a new collection required engineering involvement. There was no interface for analysts or external government customers to define collection needs or track task status. The challenge was two-layered: a simple 4-step frontend form for any user, wrapped around a 7-stage internal pipeline running automatically after submission.
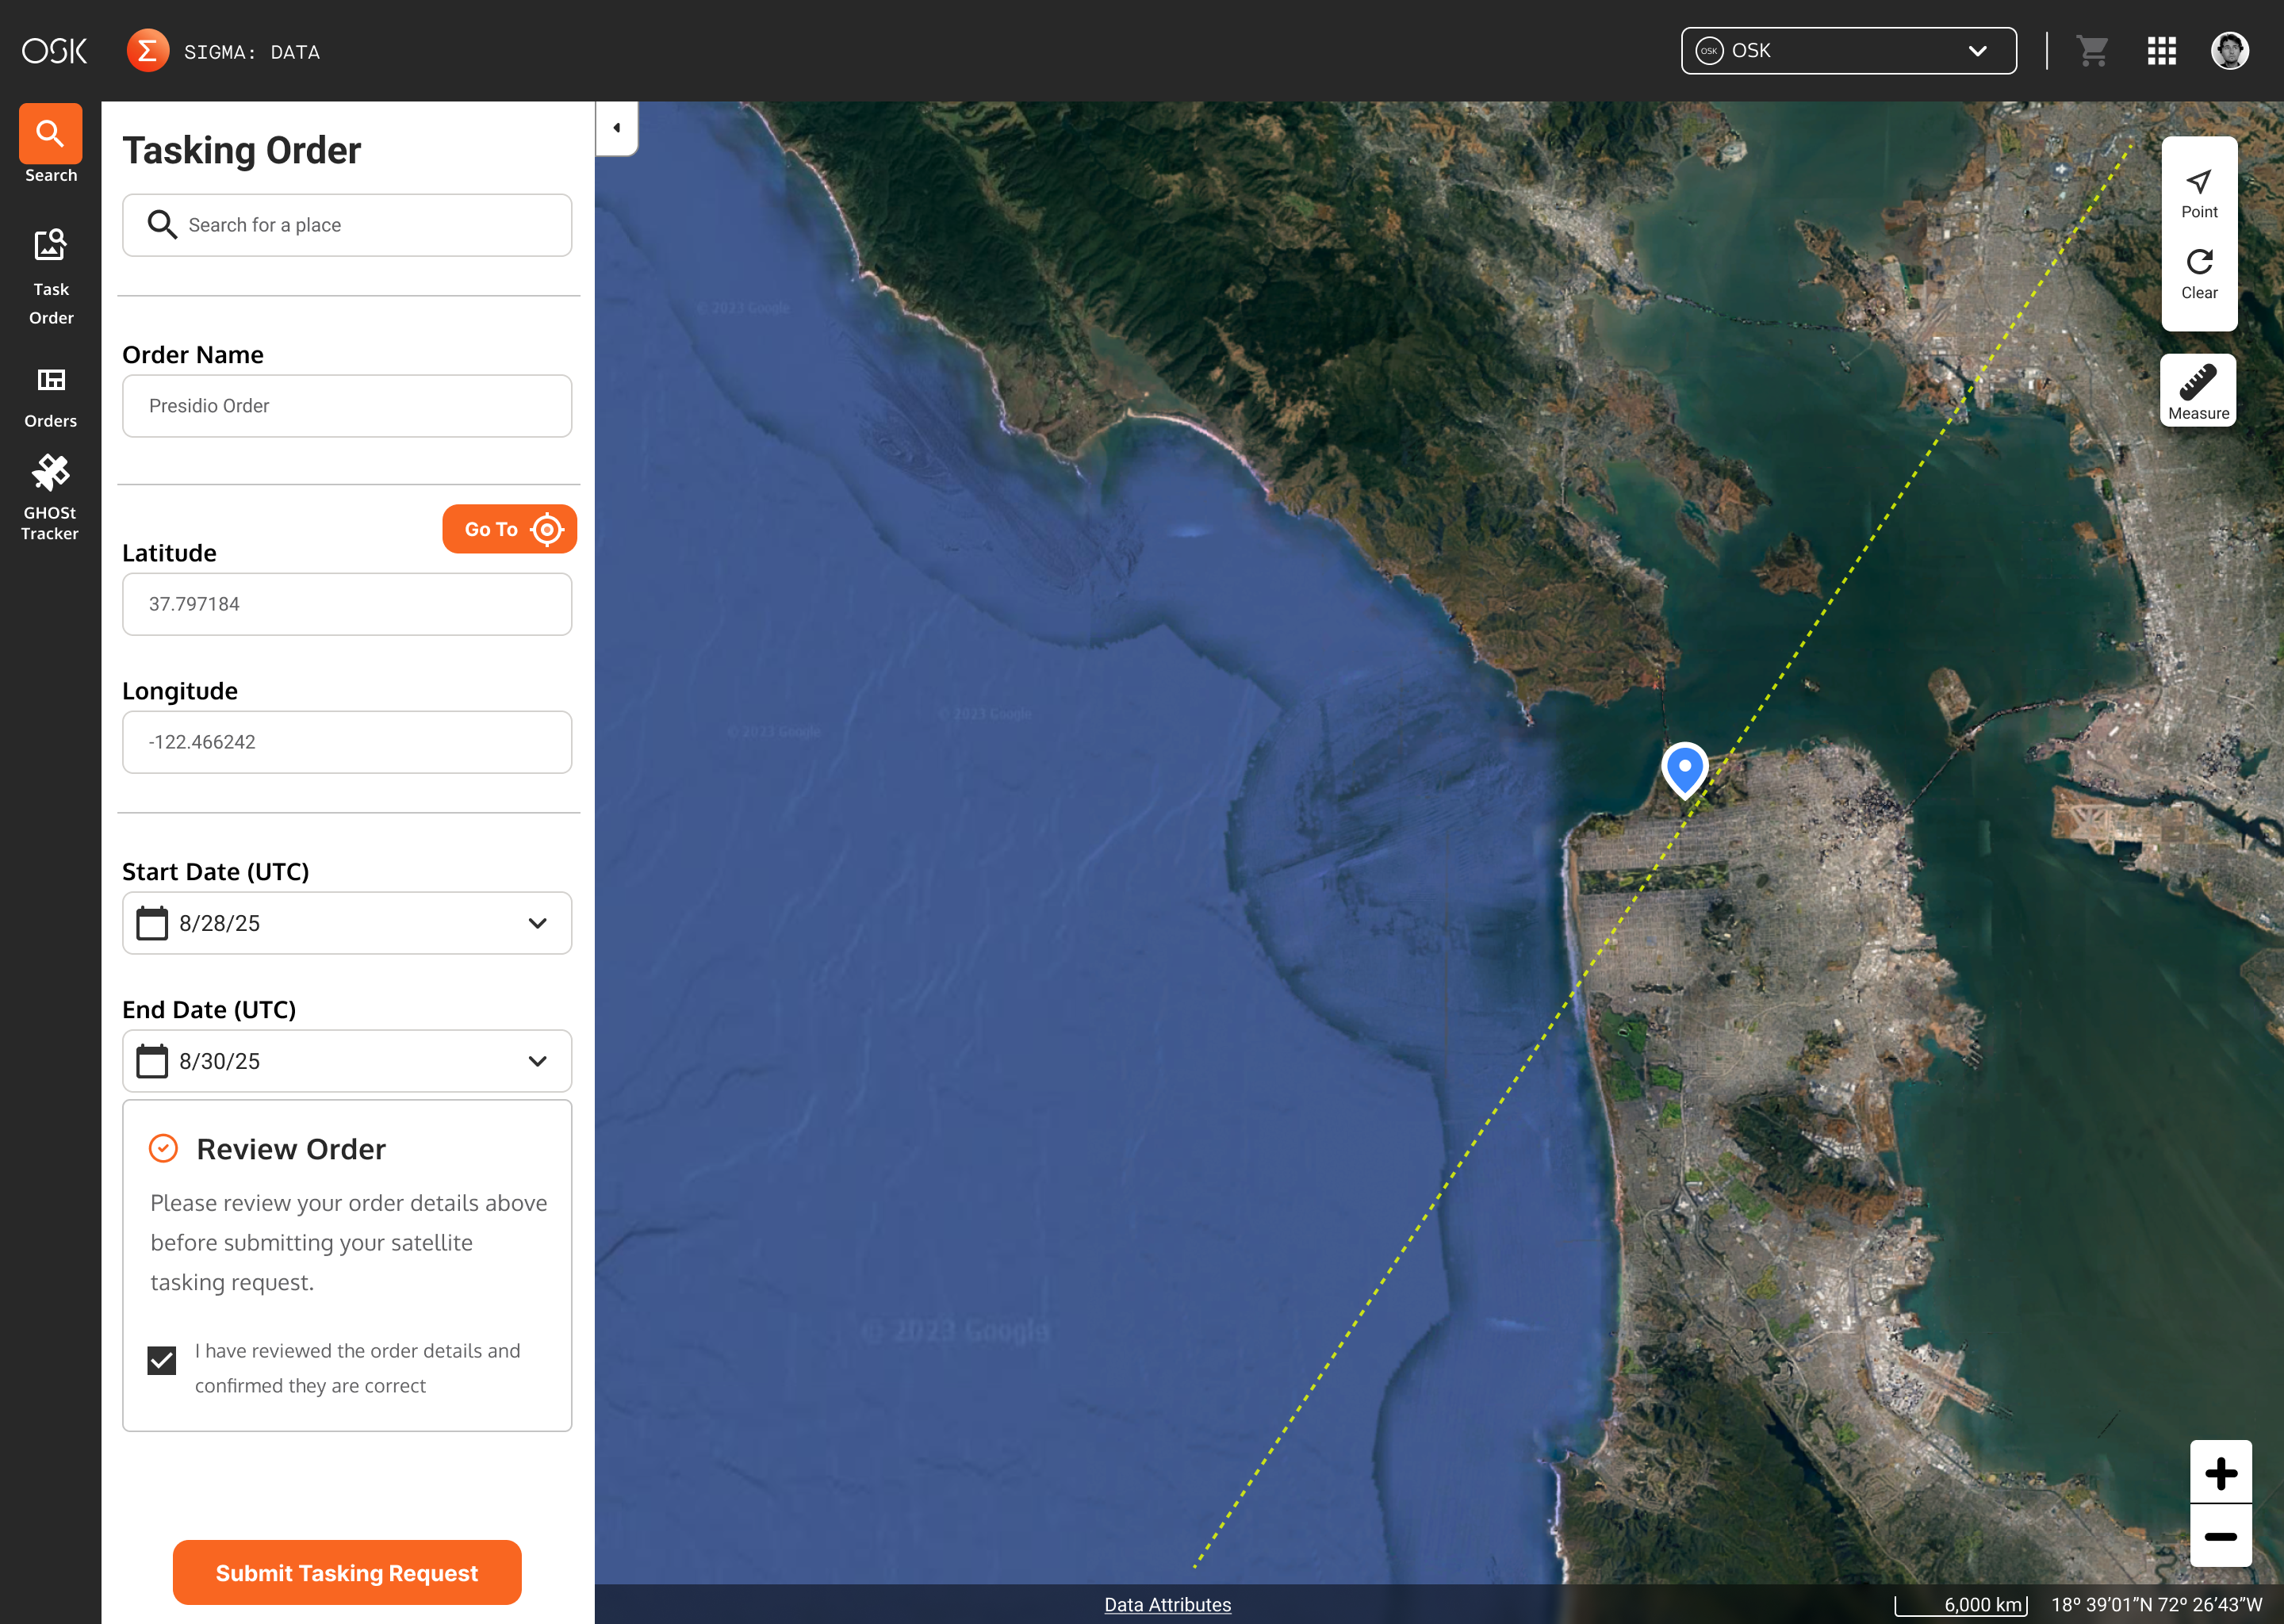
Tasking orders came in through the tasking order form, where a user could request a point target, define the time range, and set a priority level. Each order was routed to the payload team, who evaluated it for imaging opportunity and feasibility using their own internal operations tools to make the final call. Designing this meant designing a genuine back and forth between the customer and that team, balancing customer experience with operational reality.
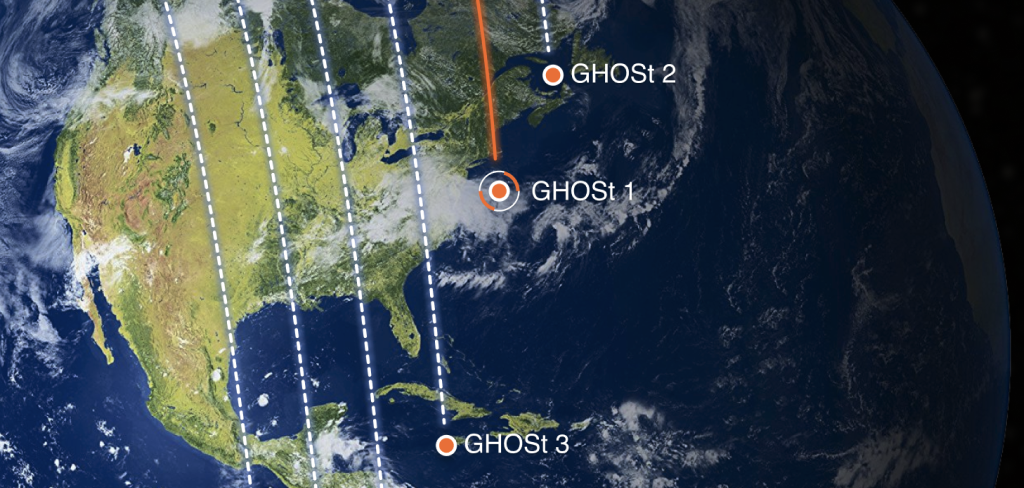
Constellation Viewer
The constellation felt abstract, a background system with no face. Users had no way to see which satellites existed, what they were capable of, or when they would pass over an AOI. Beyond operations, the viewer needed a second life: a live showpiece for demos, investor decks, and conferences.
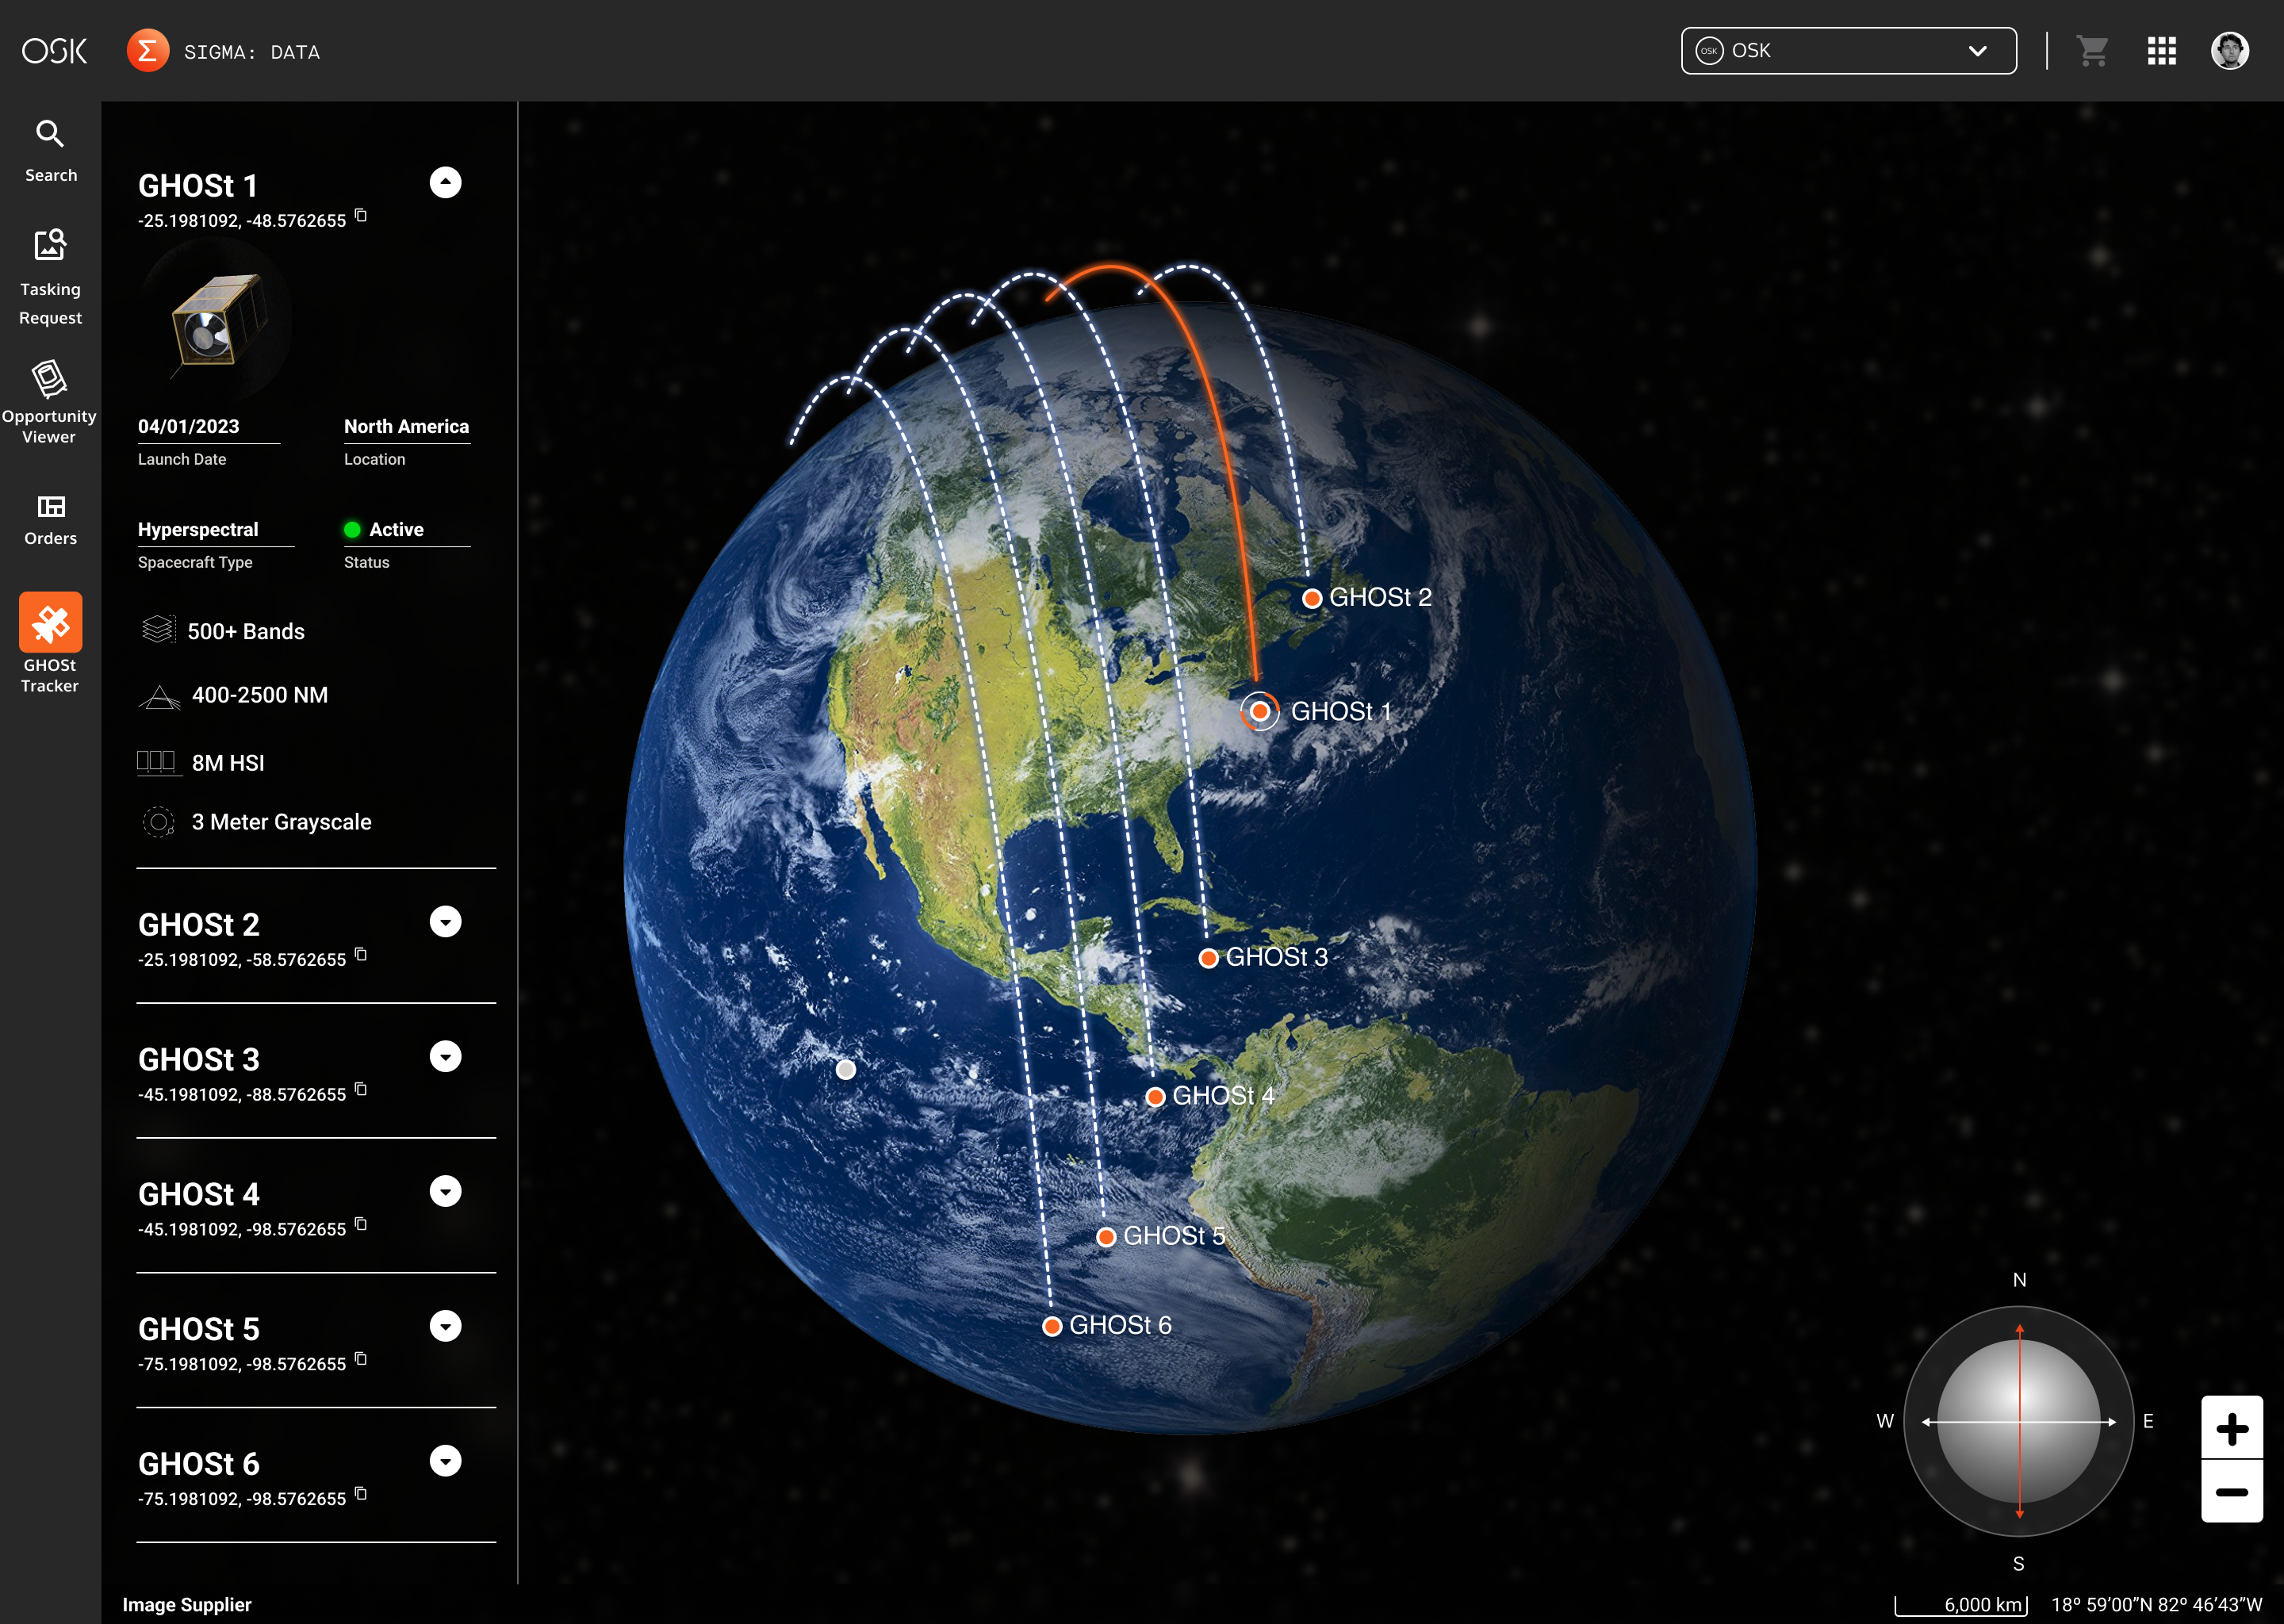
A live view of the GHOSt fleet orbiting Earth, showing where each satellite is in real time.
Environmental & National Impact
SIGMA Data powered some of the most consequential applications of commercial hyperspectral remote sensing to date, reaching federal intelligence programs, environmental missions, and national security customers around the world.
1.6M km²
Area of Operations
Monitored & Archived
Multiple Findings
Chemicals, Materials & Substances of National-Security Concern Identified
4+
National & Allied
Customers Served


Geopolitical Intelligence
Following Operation Midnight Hammer on June 22, 2025, OSK analysts used hyperspectral data from the GHOSt-5 satellite to assess damage to the underground Fordow facility, a site previously inaccessible to standard optical analysis.
PCA analysis revealed a linear subsurface structure measuring approximately 315m × 275m beneath the mountain, interpreted as ground shift from potential collapse of the underground facility. Spectral fingerprinting positively identified three of four concrete signatures adjacent to bomb entry points, confirming the gray surface material as concrete ejected from the destroyed underground structure.
This demonstrated hyperspectral sensing's ability to reveal material and structural intelligence invisible to traditional electro-optical imagery, a level of precision previously limited to government programs.
Read the full analysis →Environmental Intelligence
From November to December 2024, OSK captured HSI data over Eaton Canyon revealing that south-facing slopes near Altadena showed significantly drier, less healthy vegetation than north-facing slopes, months before the fires ignited. When the Eaton Fire burned, the correlation between pre-fire vegetation health indices and fire perimeter was striking.
Post-fire, the Normalized Burn Ratio (NBR) derived from OSK's SWIR bands showed near-perfect correlation with CAL FIRE's Palisades Fire perimeter. Analysis of HSI-derived RGB composites overlaid with the DINS structural damage database mapped burned and surviving areas at a resolution and fidelity unavailable with traditional multispectral sensors.
The data was subsequently used by Federal programs to aid fire risk assessment and post-fire damage analysis across the affected areas.
Read the full analysis →

For the explorers and the watchful, the ones turning data into understanding so the rest of us can act. To the scientist, the engineer, and the designer working to make our world a better place. Thank you.


Designed &
Built in the USA
Know Now, Act Fast