DataFest 2018
Datafest 2018 was held at Chapman University in the Spring of 2018.
While there, undergraduate students from top Southern California universities including UCSD, UCI, and USC gathered at Chapman University to compete in the American Statistical Association's DataFest Competition.
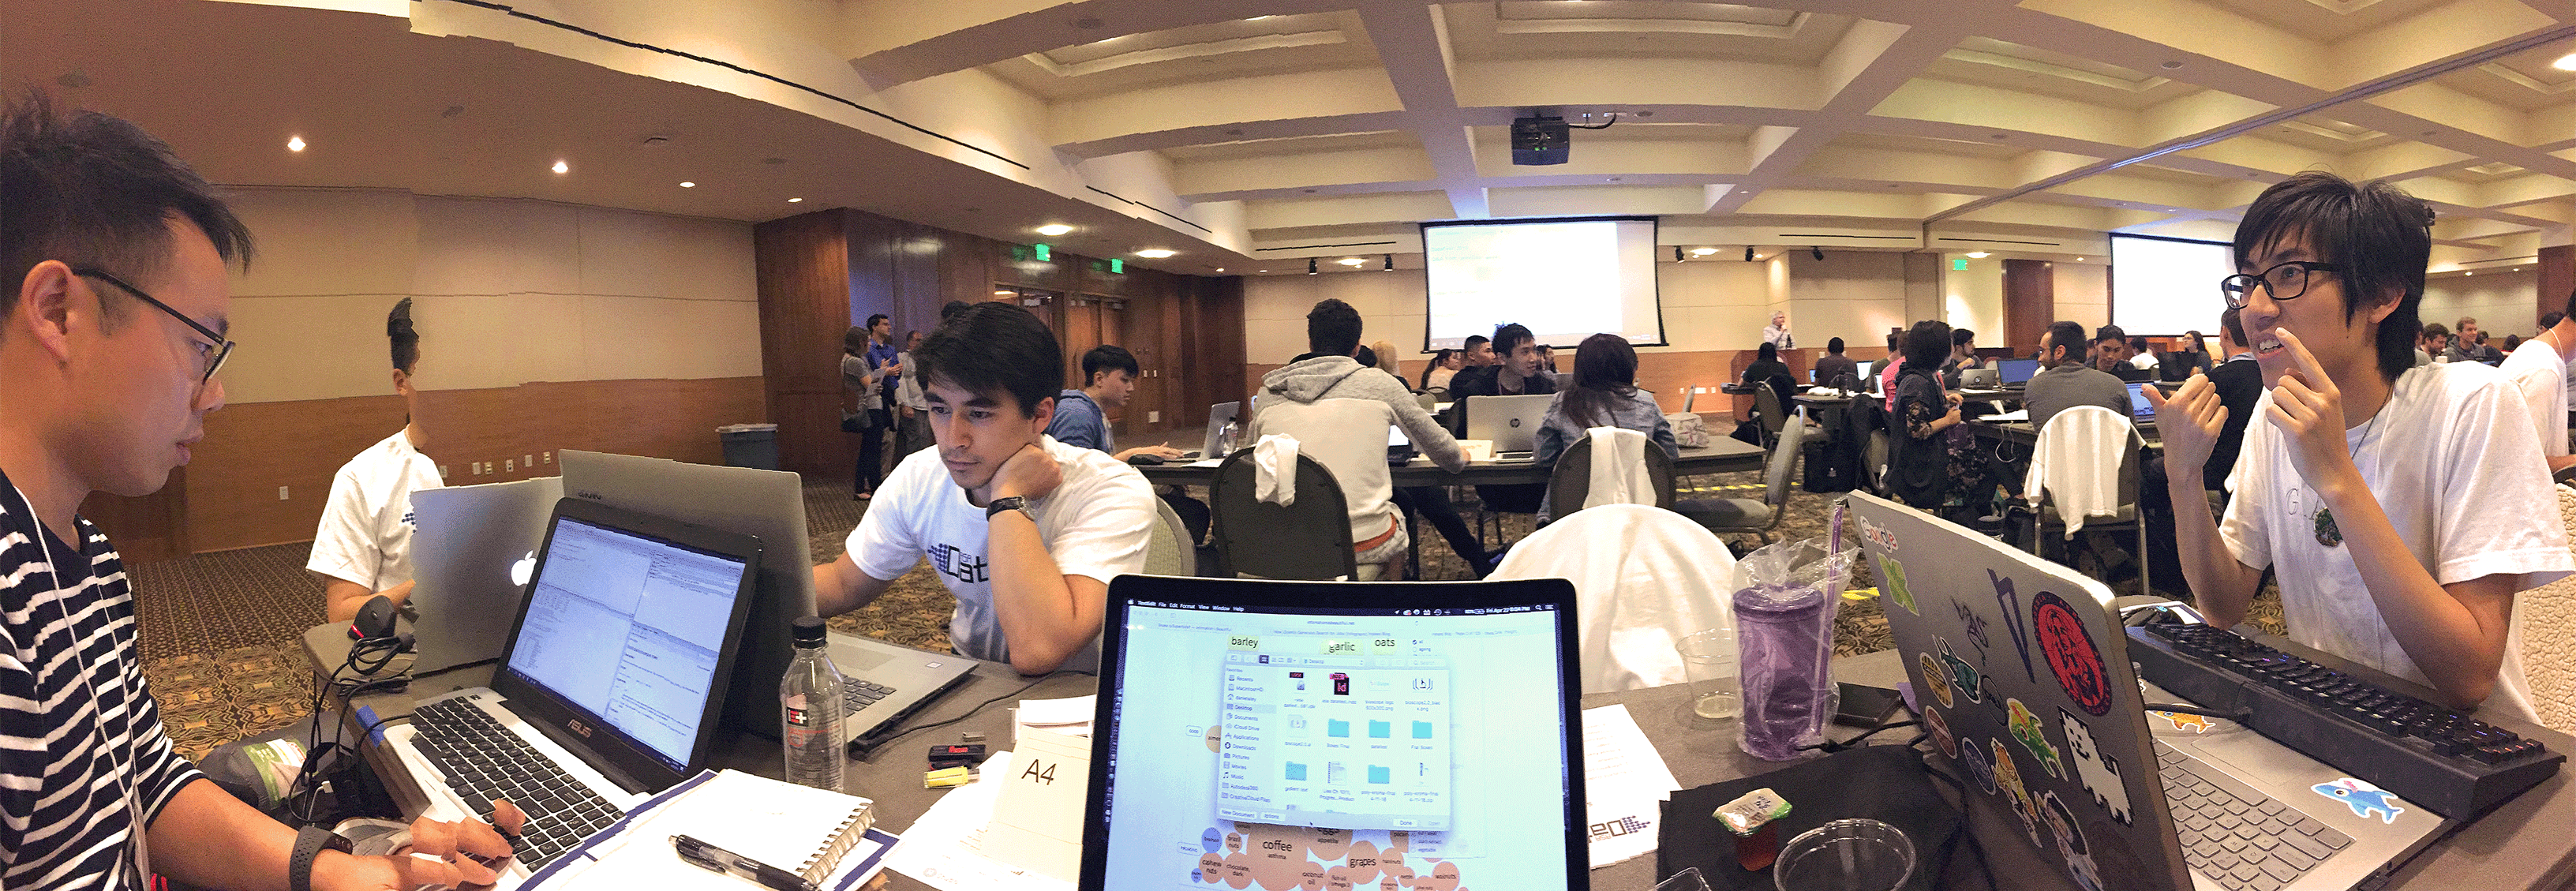
This annual event involves teams of 2-5 students working furiously over a 48-hour period
often even sleeping on site at the host university location) to analyze a real dataset supplied by an industry sponsor; the event is simultaneously hosted at dozens of cities throughout the country.
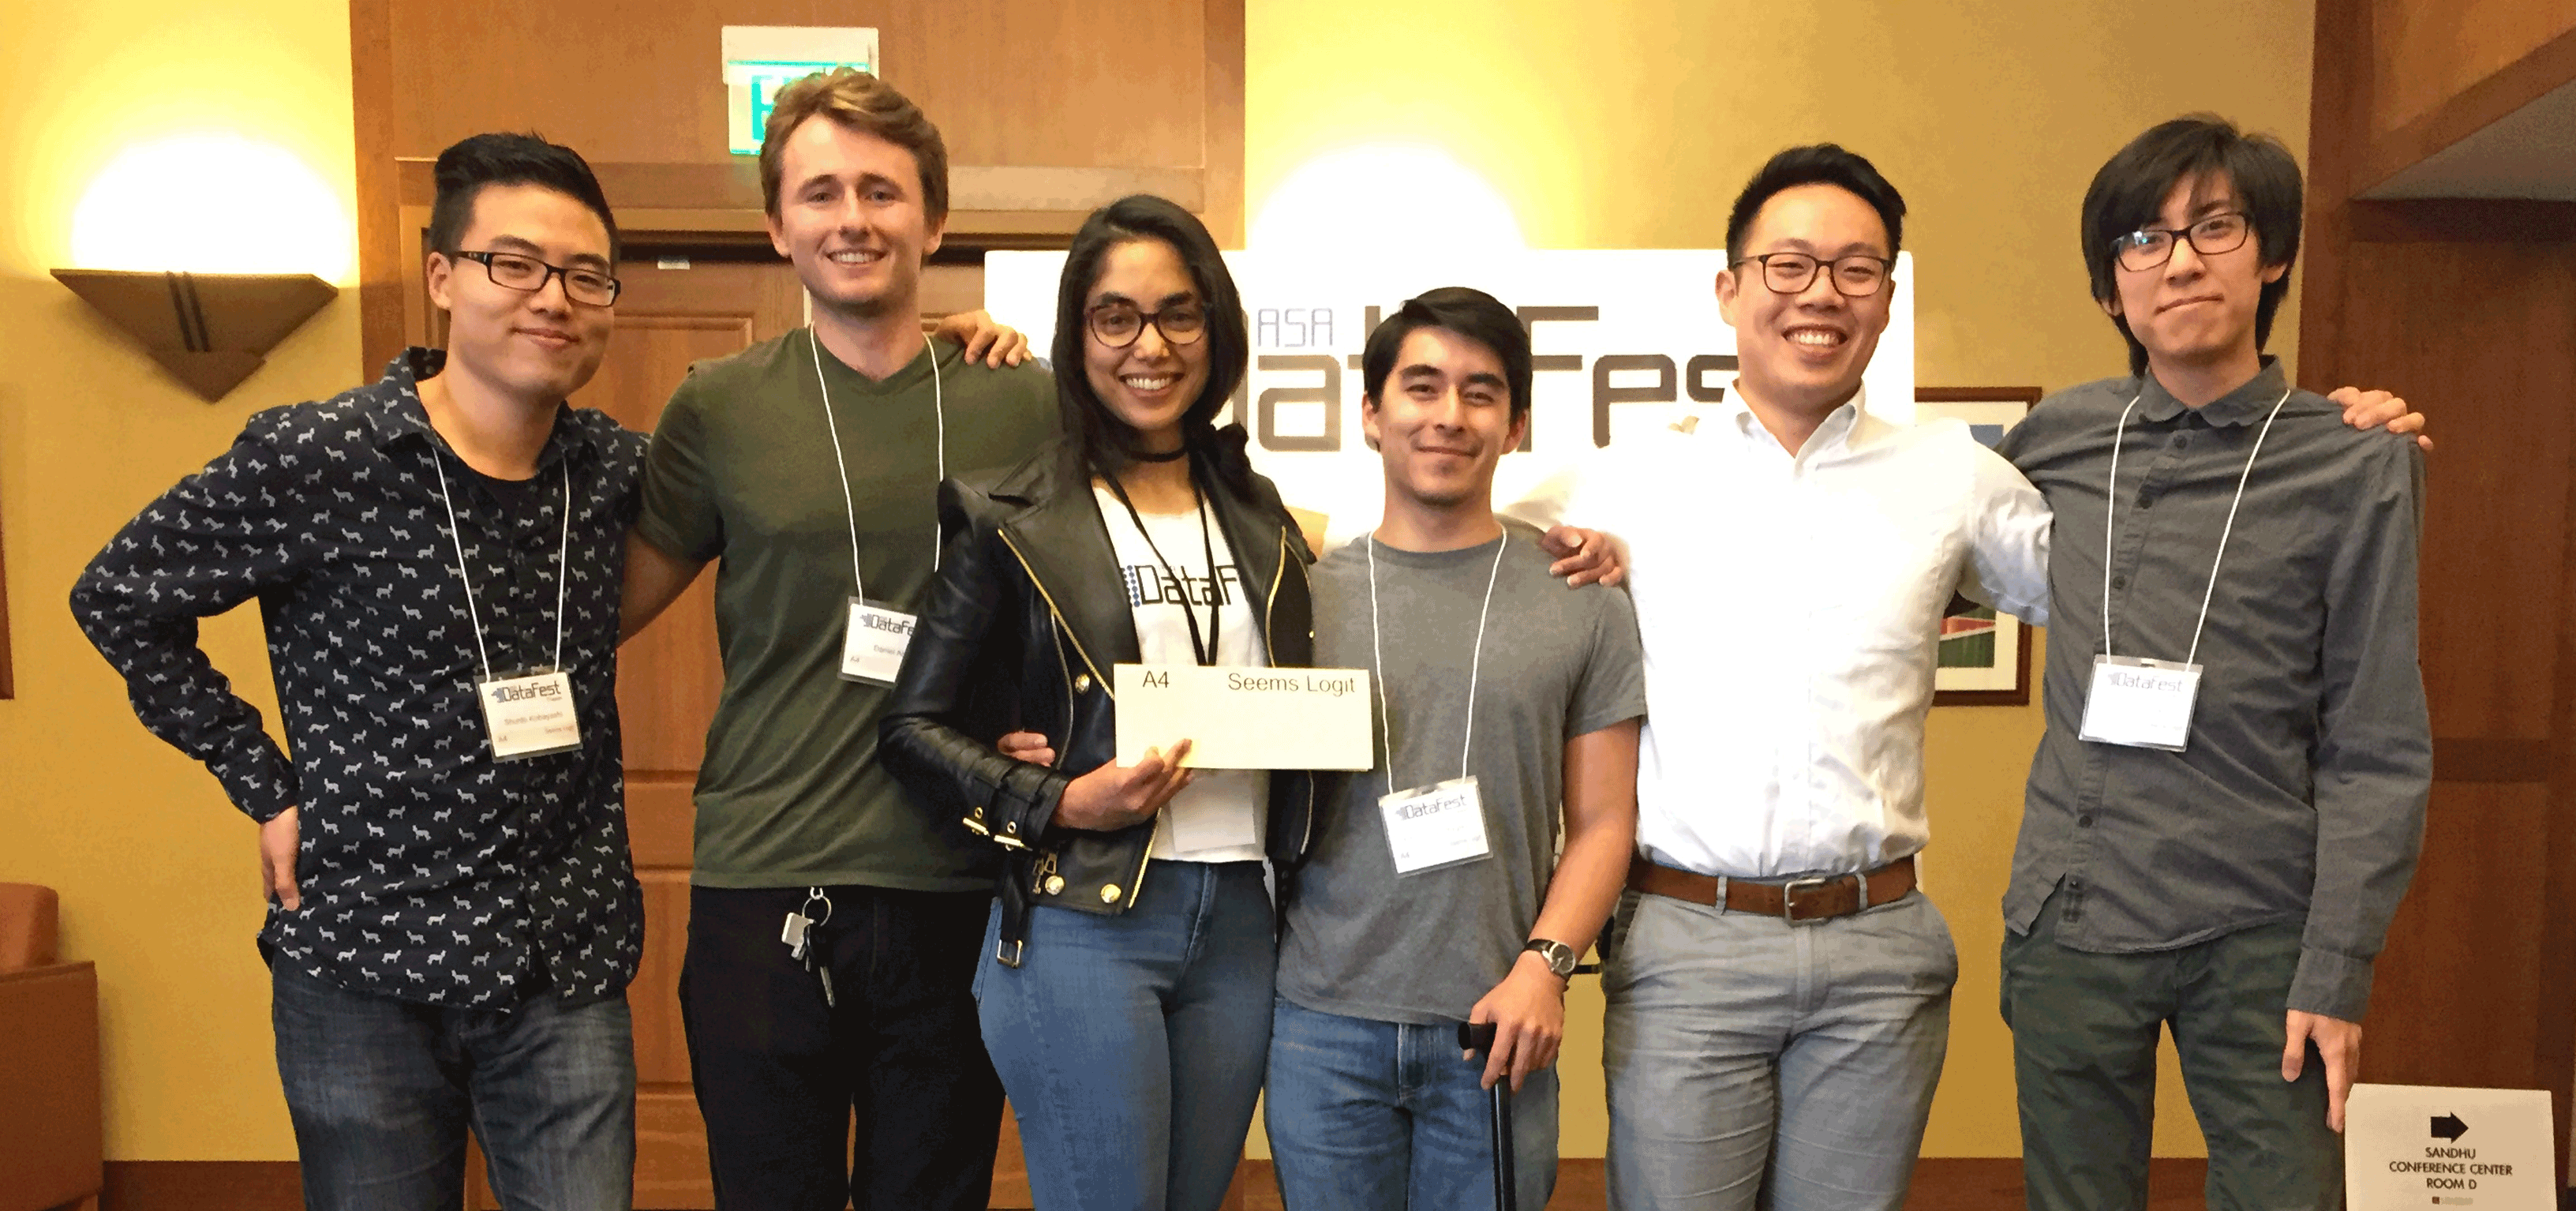
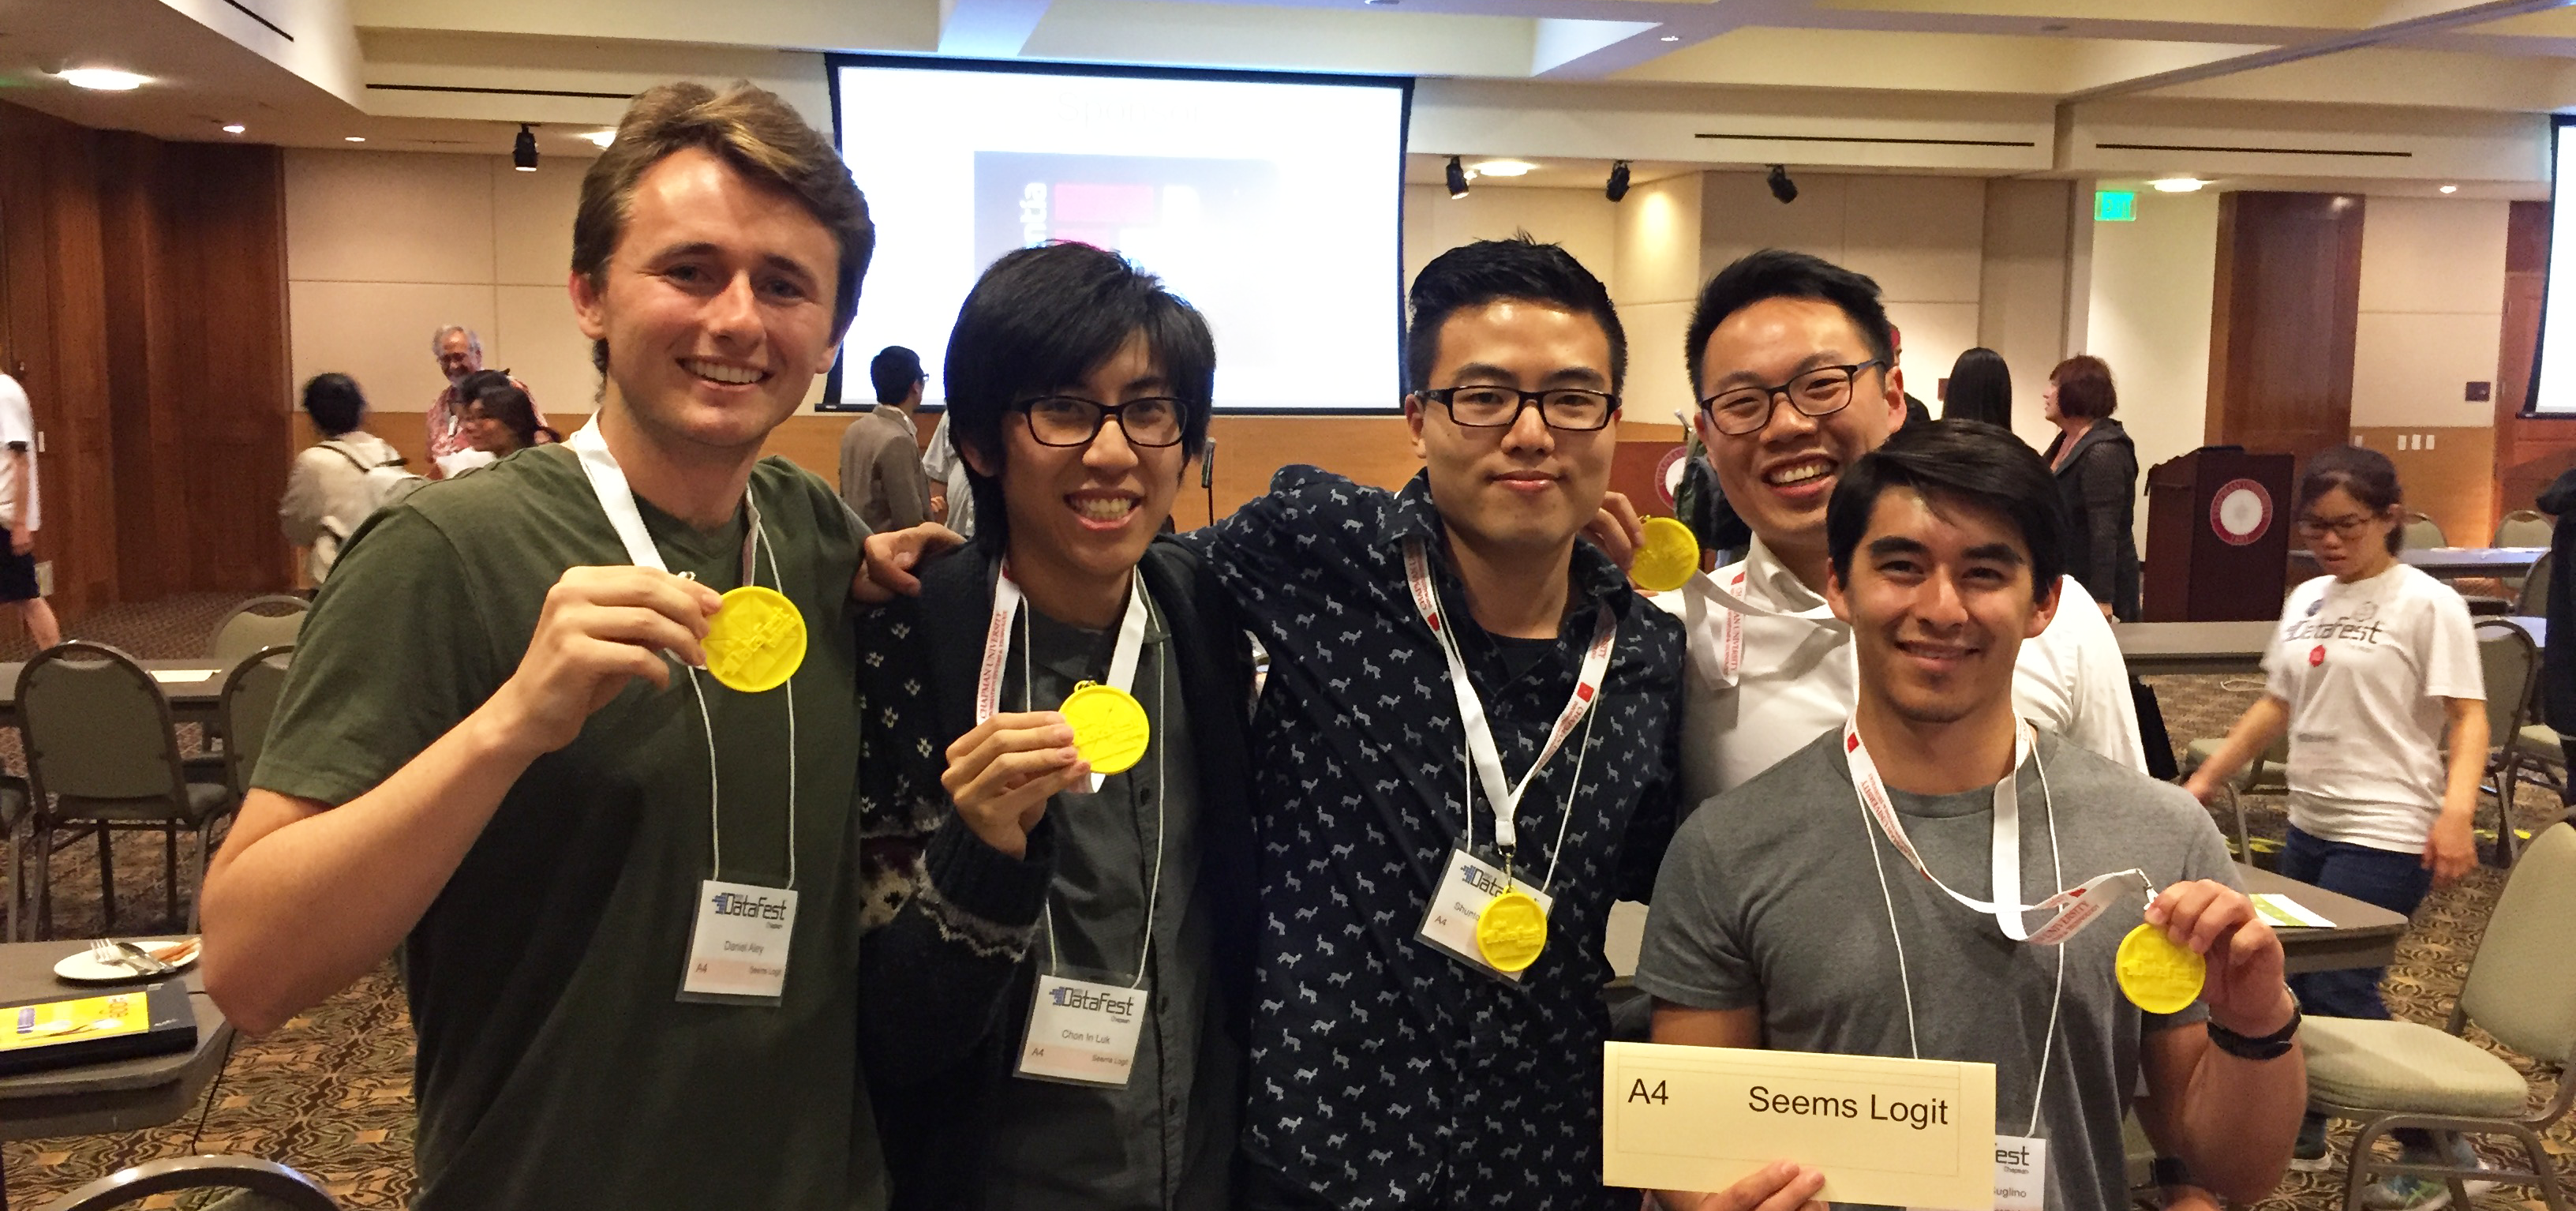
This year, the jobs website Indeed supplied data consisting of 14.5 million job postings, with an open ended challenge to identify trends related to different job categories represented in the sample. While such a large, complex data set would intimidate many undergraduate students, Cal Poly Pomona's team "Seems Logit" (a play on the stat term "logit") was not fazed. The team consisted of an interdisciplinary group of majors from across campus: Daniel Aley (Graphic Design and CIS minor), Christopher "Ren" Buglino (English and Math/Stat double), Brendon Chau (Industrial Engineering), Shunto Kobayashi (Economics and Math/Stat double), and Chon in "Dave" Luk (Computer Science and Math/Stat double).
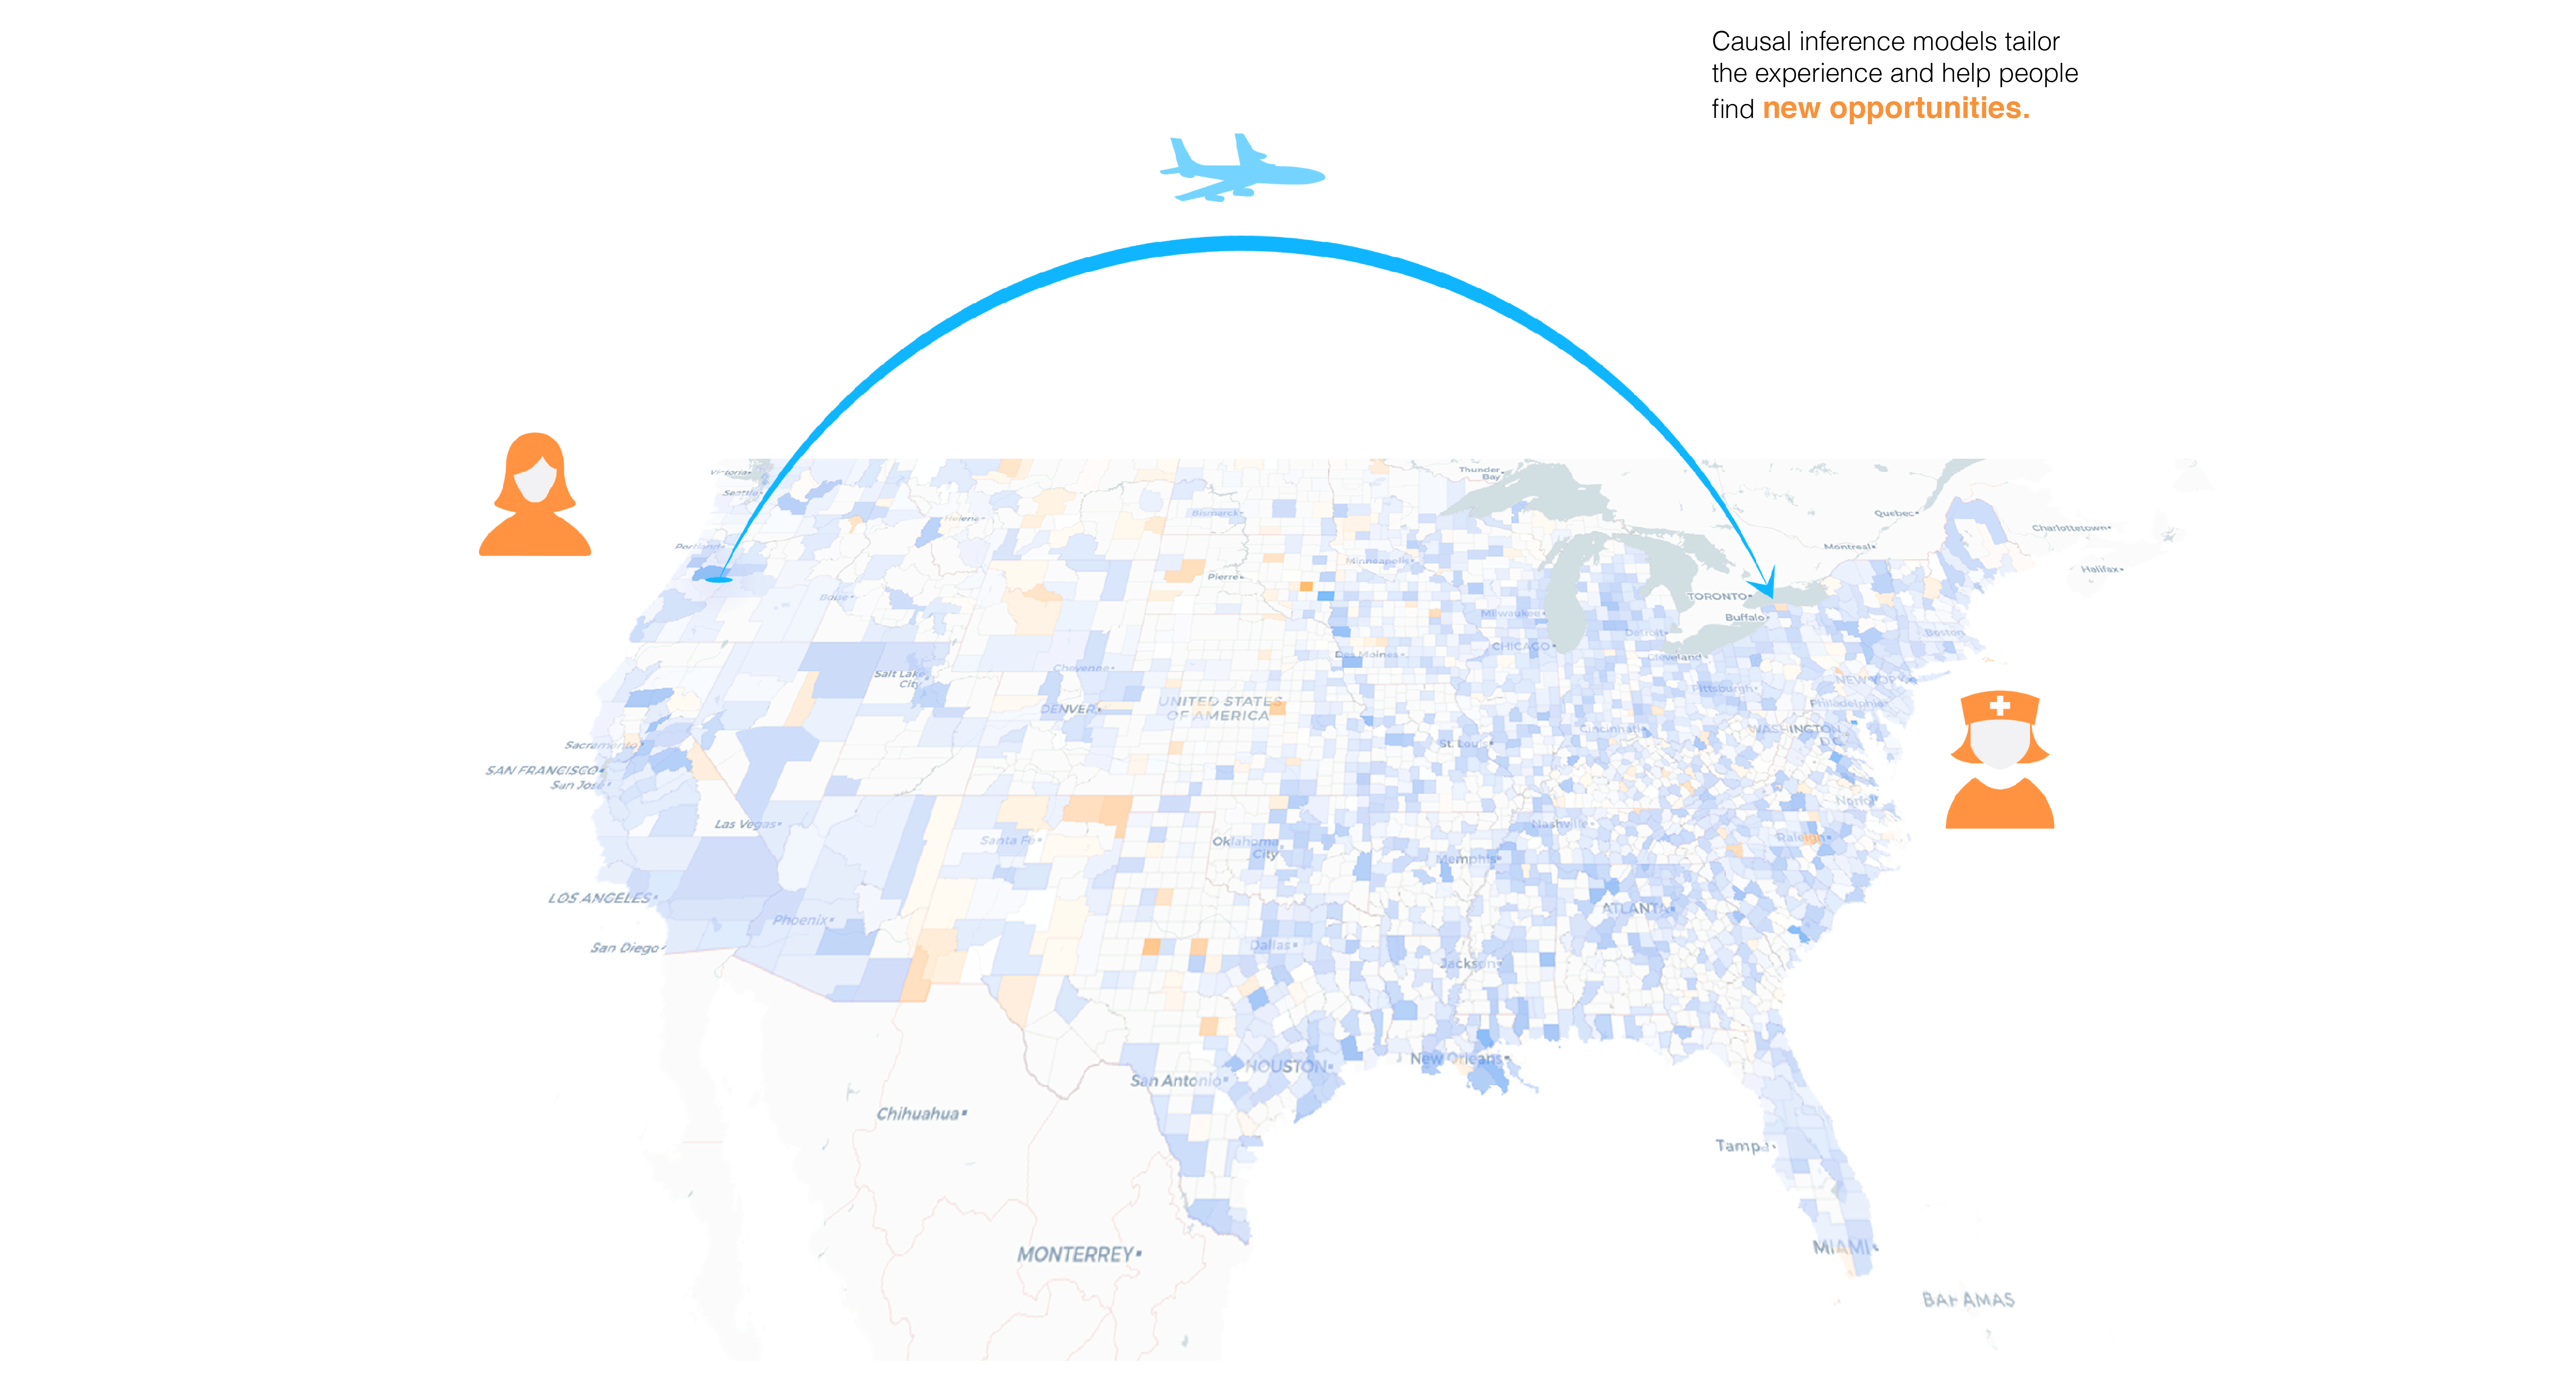
Over the course of the weekend, the team handled tasks ranging from data wrangling (handling extensive missing data, linking to external U.S. Census Bureau data) to application of advanced modeling techniques such as Support Vector Machines, Neural Networks, and Random Forests, and infographic design.
Challenges the team faced included working with a rich/messy "Big Data" set, coordinating work across a group of five people (including sharing of code), and dealing with the exhaustion of the weekend long data analysis marathon.
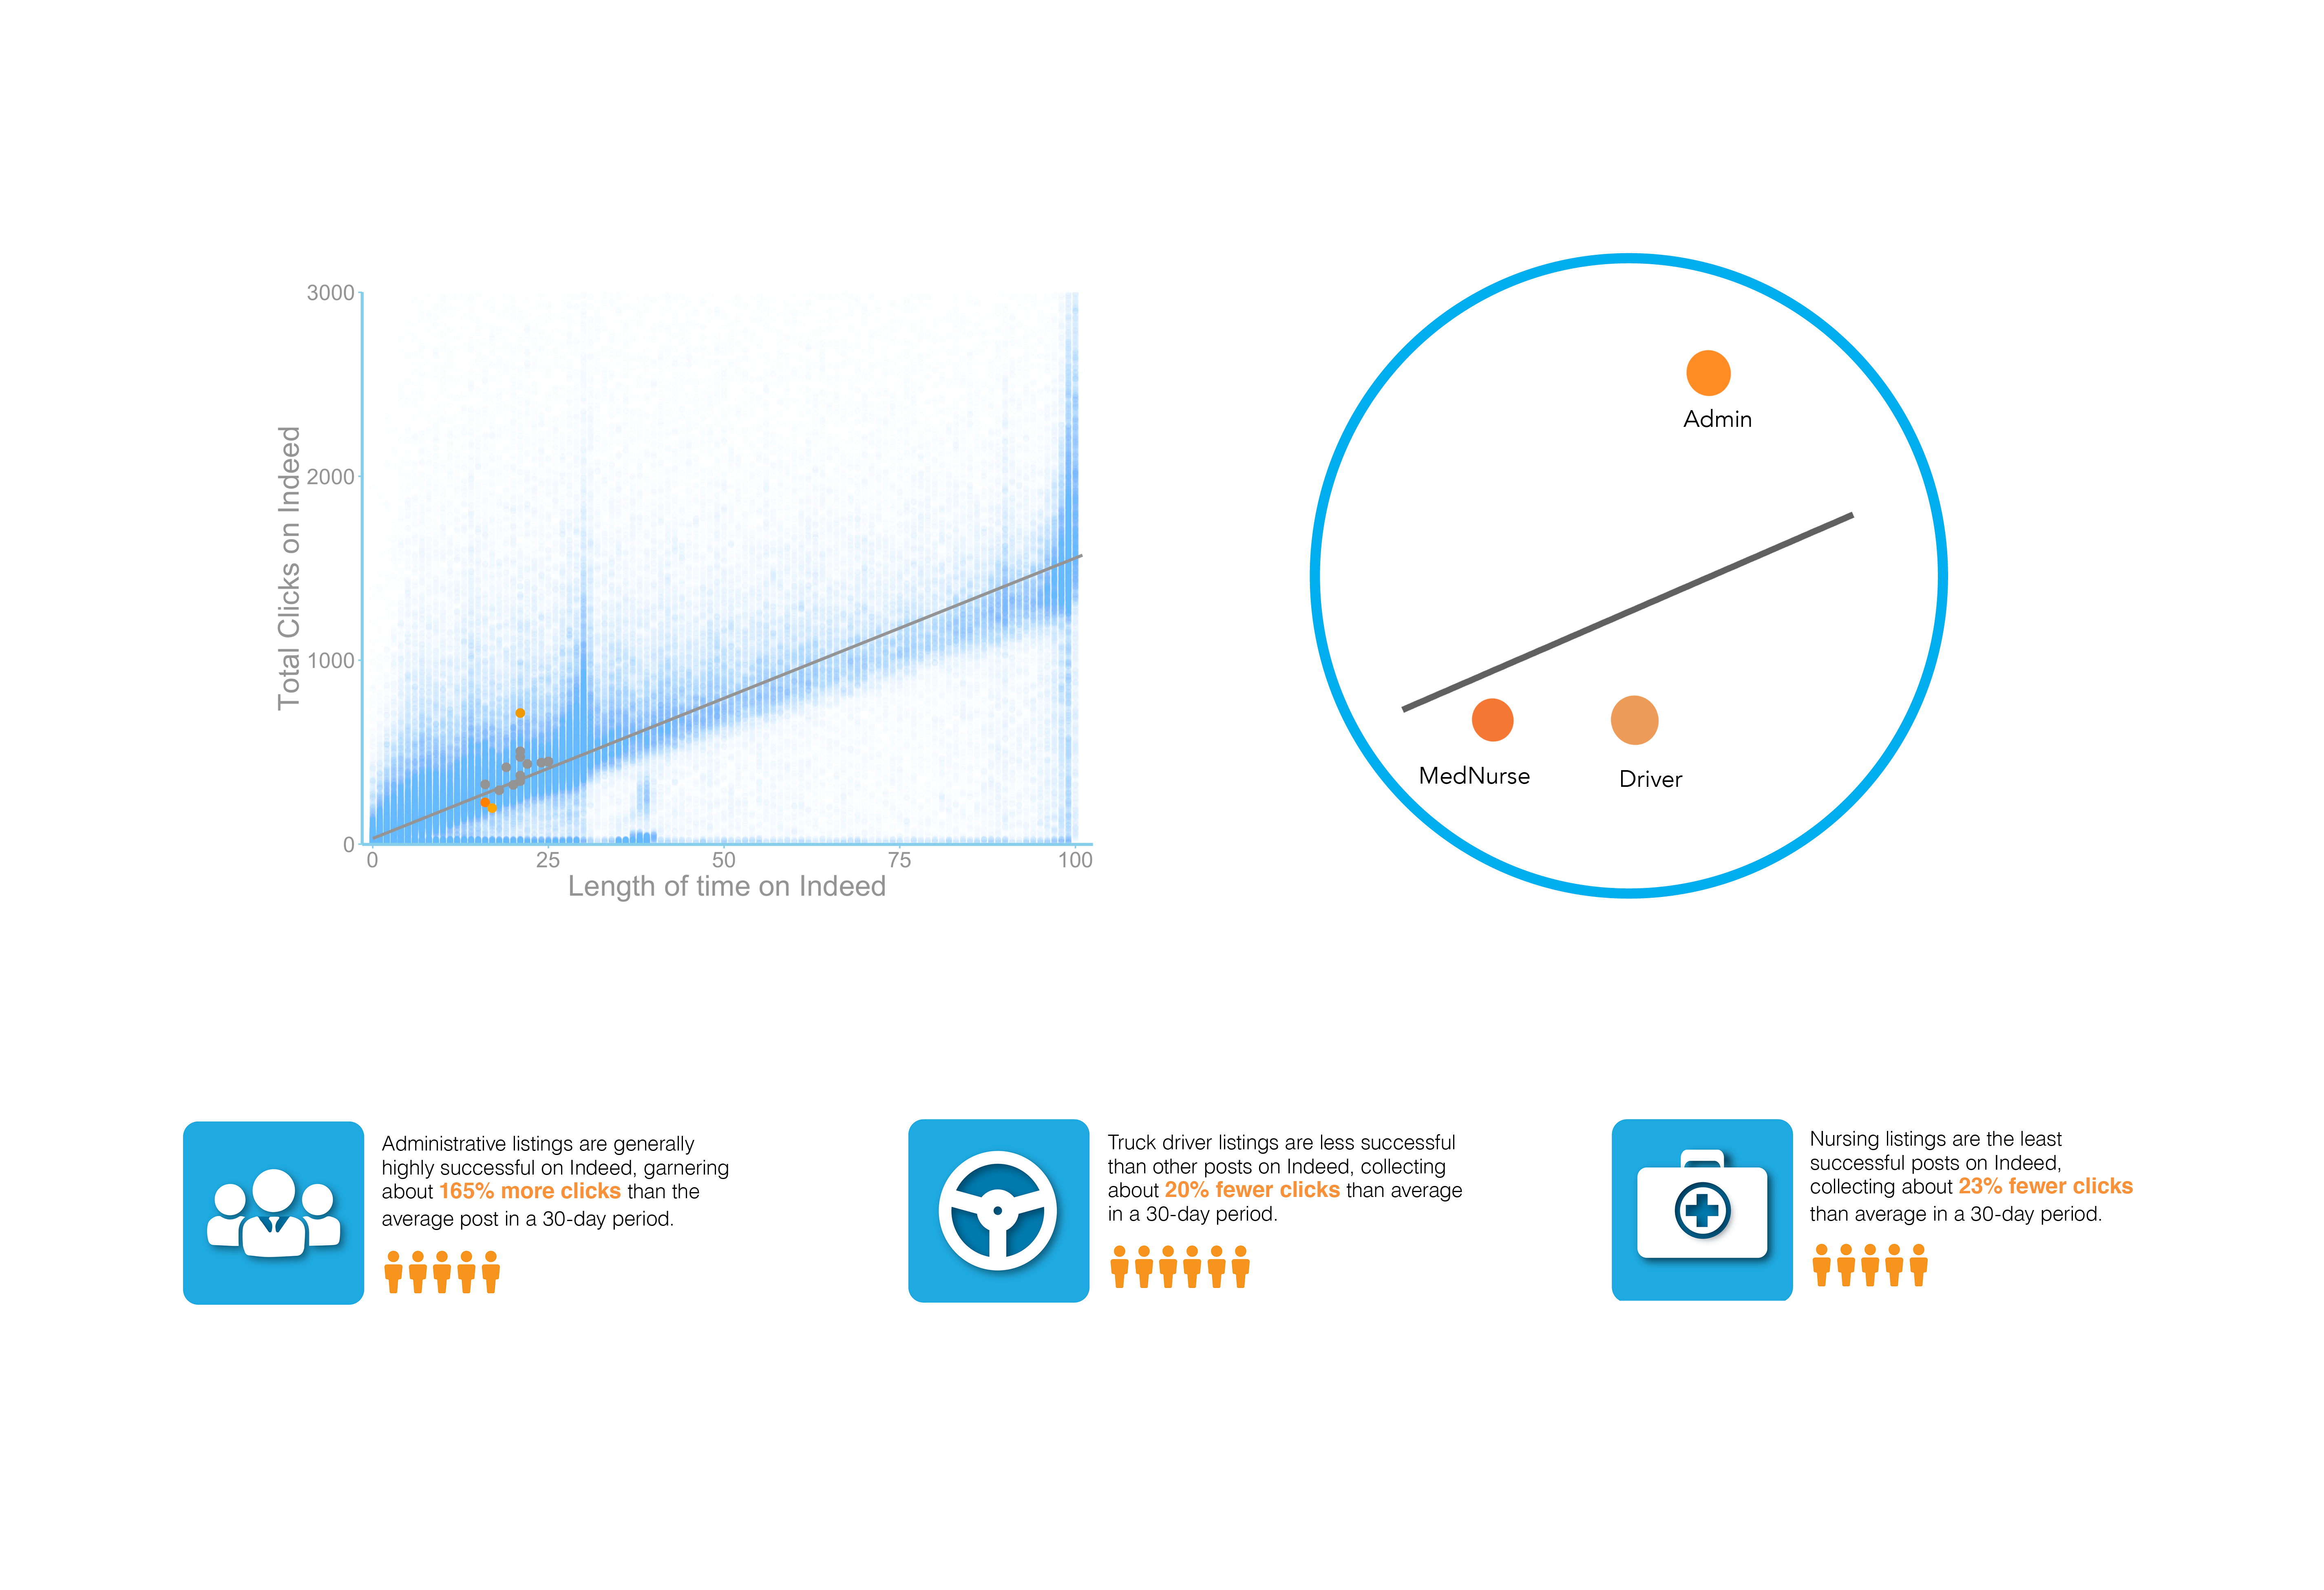
In the end though, their hard work (and sometimes painful sleeping locations) payed off: After delivering their final presentation Sunday afternoon, they were awarded the top prize for Data Visualization, for among other things producing a beautiful graphic illustrating the distribution of several popular job types throughout the United States. They cite not only the overall strength of their team (consisting of some of Cal Poly Pomona's top talent from across campus), but also the individual skills each brought to the table.